Wheat production in Türkiye has experienced various fluctuations over the last quarter-century. Production, which was 21.0 million tons in the 2000/2001 season, reached 22.0 million tons in the 2023/2024 season. However, production quantities showed significant differences from year to year during this period.
Table: Türkiye Wheat Production and Change Compared to the Previous Period
Period | Production (Mt) | Change |
|---|---|---|
2000/01 | 21.0 | - |
2005/06 | 21.5 | +2.4% |
2010/11 | 19.7 | -8.4% |
2015/16 | 22.6 | +14.7% |
2020/21 | 20.5 | -9.3% |
2023/24 | 22.0 | +7.3% |
Note: Fluctuations in wheat production show significant year-to-year differences, primarily depending on climatic conditions.
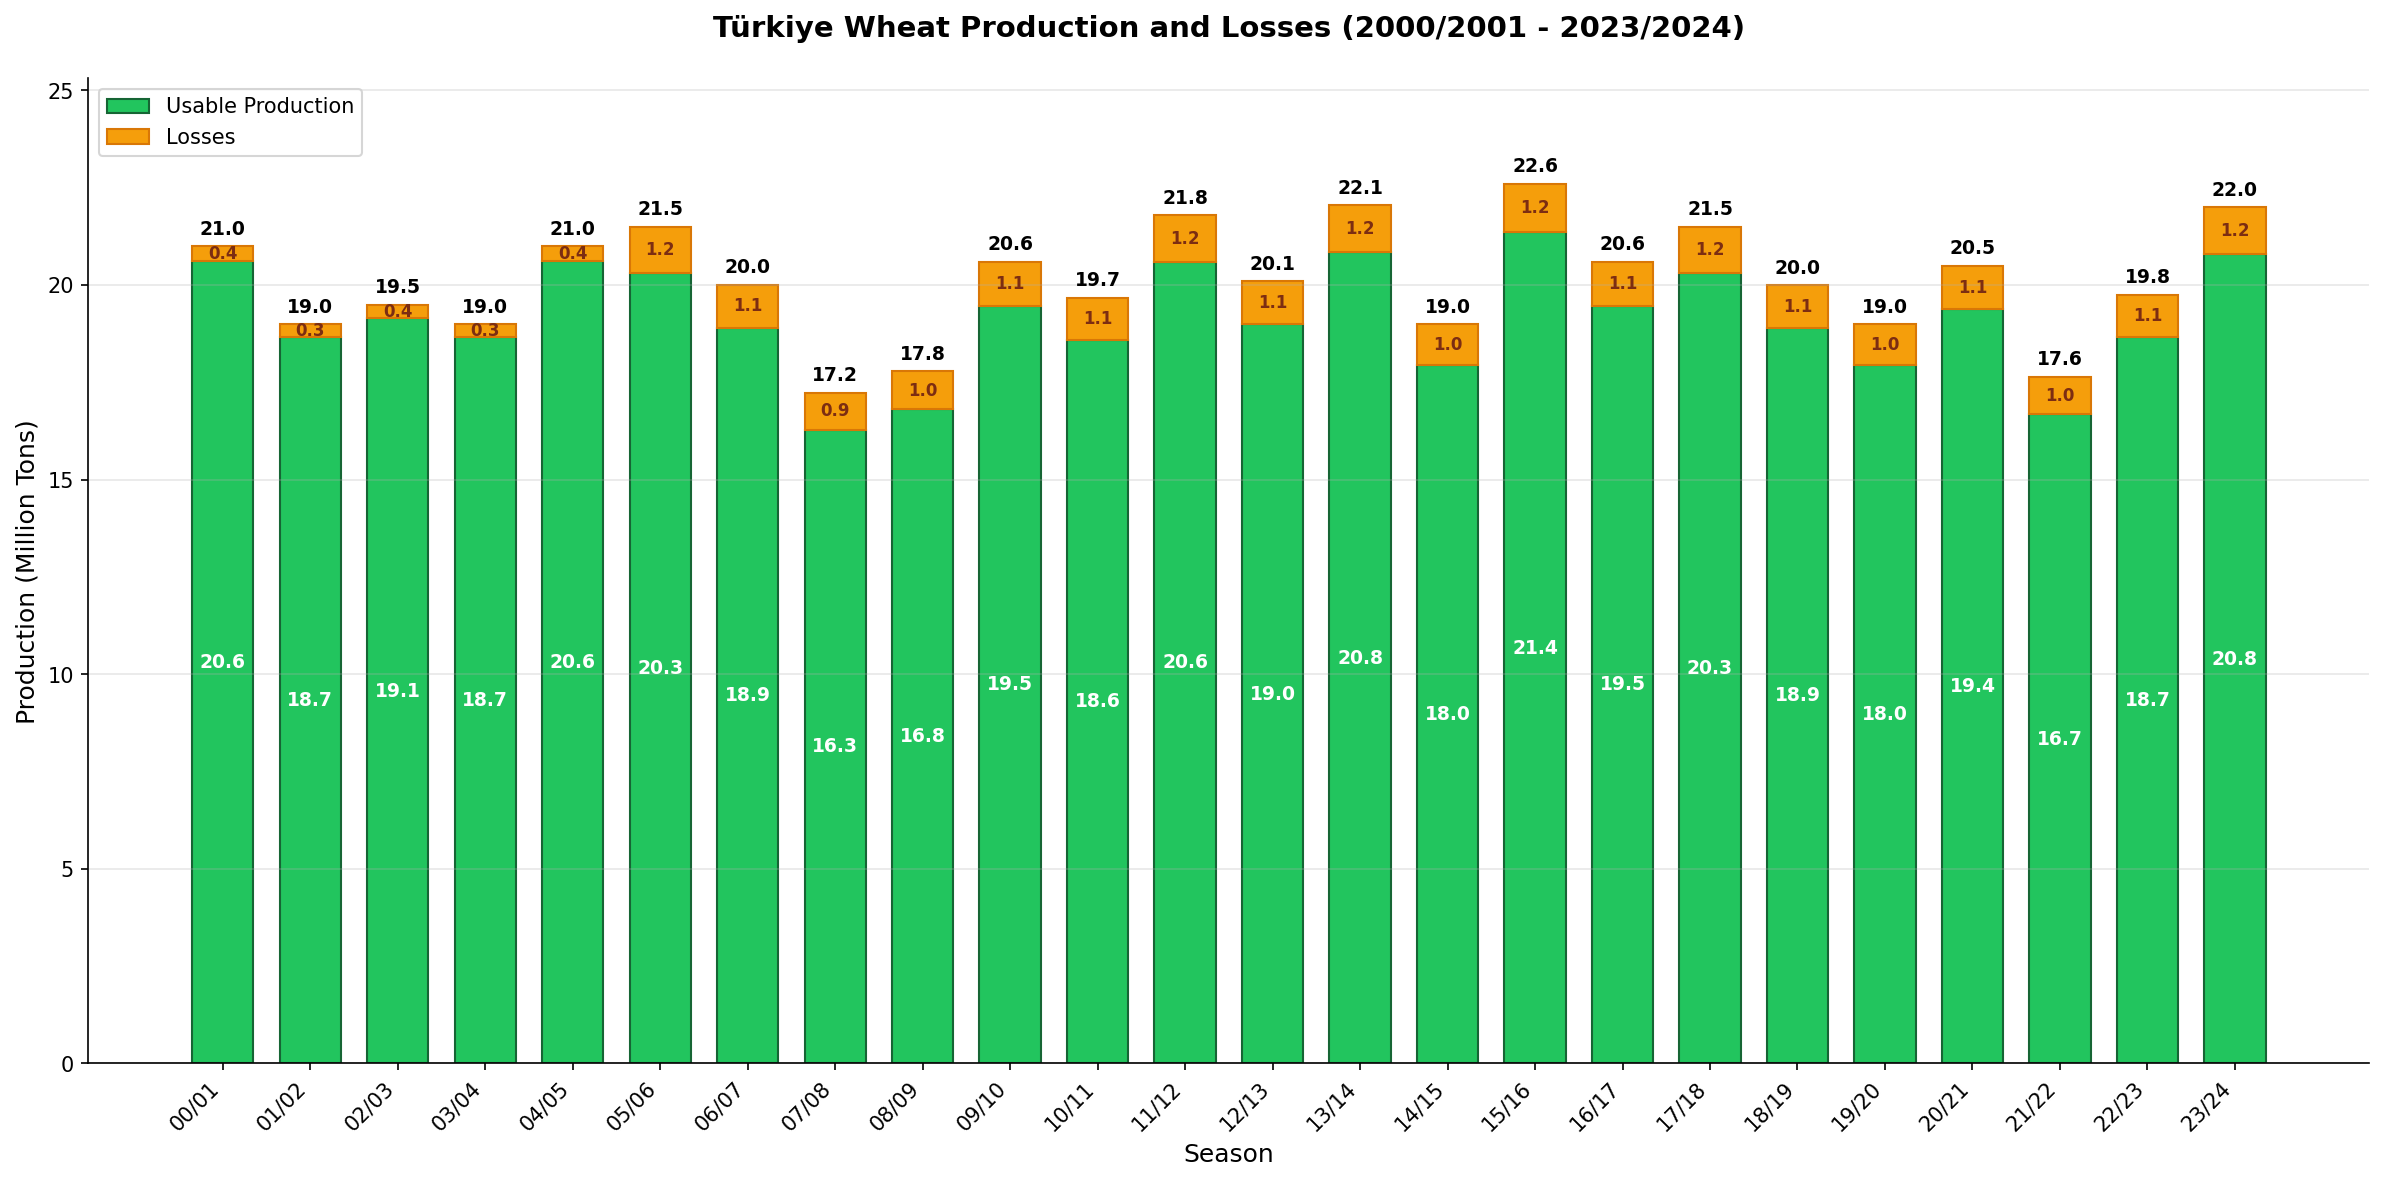
The graph clearly reveals that wheat production shows significant fluctuations from year to year. Production amounts can exhibit differences of up to 20%, especially depending on climatic conditions.
When the data is analyzed, harvest losses rose from 1.8% (378 thousand tons) of production in the 2000/01 season to 5.5% (1.21 million tons) in the 2023/24 season. This increase can be attributed to factors such as changes in production techniques, increasingly difficult climatic conditions, and the introduction of more rigorous recording systems. Loss rates at this level create concern regarding food security.
Cultivation Areas and Productivity
During the period under review, a distinct contraction occurred in wheat cultivation areas, with sowing grounds declining from 9.4 million hectares to 6.8 million hectares. However, in stark contrast to this reduction in area, significant momentum has been gained in agricultural productivity. This is clearly evidenced by the rise in yield levels from 2.23 tons/hectare in the 2000/01 period to 3.22 tons/hectare as of 2023/24.
Table: Change in Cultivation Areas
Period | Cultivation Area (Million Hectares) | Change |
|---|---|---|
2000/01 | 9.40 | - |
2010/11 | 8.10 | -13.8% |
2020/21 | 6.92 | -14.6% |
2023/24 | 6.83 | -1.3% |
Probable Causes of Productivity Increase:
Improved Seeds: Use of high-yield domestic and foreign wheat varieties.
Fertilization: Balanced and timely fertilizer applications.
Irrigation: Expansion of irrigated agricultural areas.
Mechanization: Widespread use of modern agricultural machinery.
Disease Control: Effective use of pesticides and plant protection strategies.
Consumption Structure
Domestic wheat utilization in Türkiye is characterized by a diversified sectoral distribution, reaching a total volume of approximately 17.6 million tons in the 2023/2024 period. The data highlights that the overwhelming majority of wheat is directed towards human consumption, underscoring its critical role in national food security and the staple nature of wheat-based products in the Turkish diet. The feed industry follows as a secondary consumer, driven by livestock requirements, while a strategic portion—approximately 1.2 million tons—is reserved as seeds to sustain future production cycles.
Table: Türkiye Wheat Consumption Structure
Usage Area | Quantity (Million Tons) | Share (%) |
|---|---|---|
Human Consumption | 13.6 | 77.3% |
Feed Industry | 2.2 | 12.5% |
Seed | 1.2 | 6.8% |
Other Uses | 0.5 | 2.8% |
TOTAL | 17.6 | 100% |
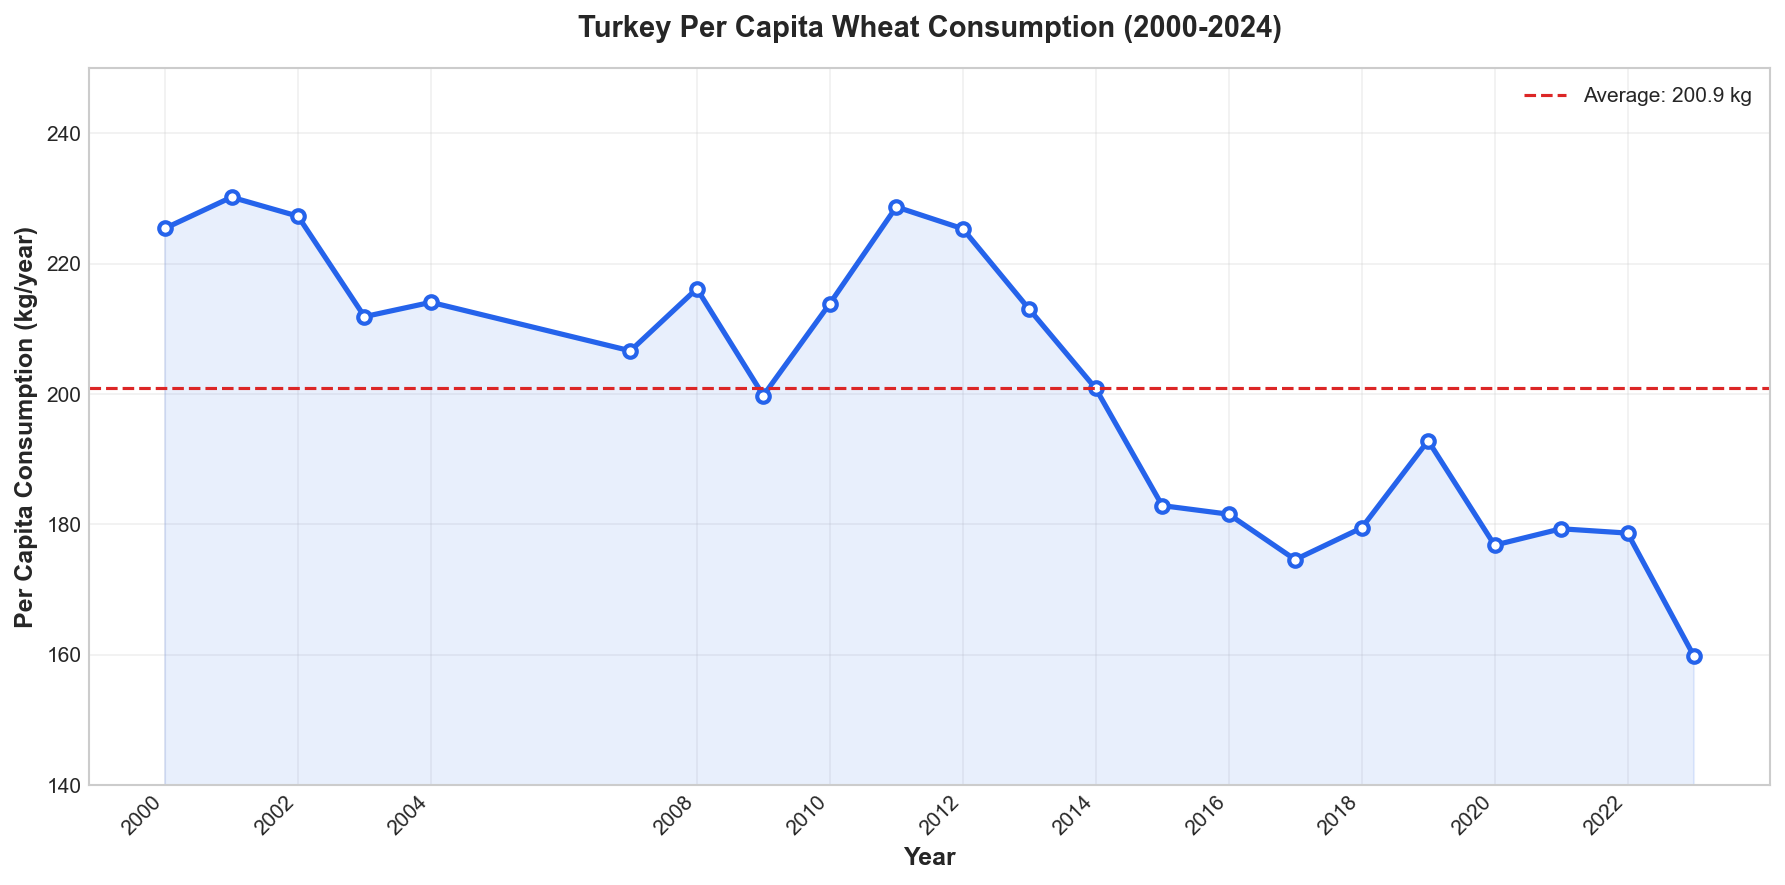
Per Capita Consumption
When the change in Türkiye's per capita wheat consumption data over the years is analyzed, it is observed that consumption, which hovered at higher levels in the early 2000s, has entered a limited downward trend with changing eating habits, urbanization, and increased dietary diversity. Although the trend in the graph shows slight fluctuations over the years, it proves that Türkiye stably maintains a level of per capita consumption (160 kg) that is more than double the world average (65-70 kg). This situation indicates that wheat maintains its indisputable leadership in the nutrition of Turkish society. Türkiye ranks in the top ten in the world in per capita wheat consumption.
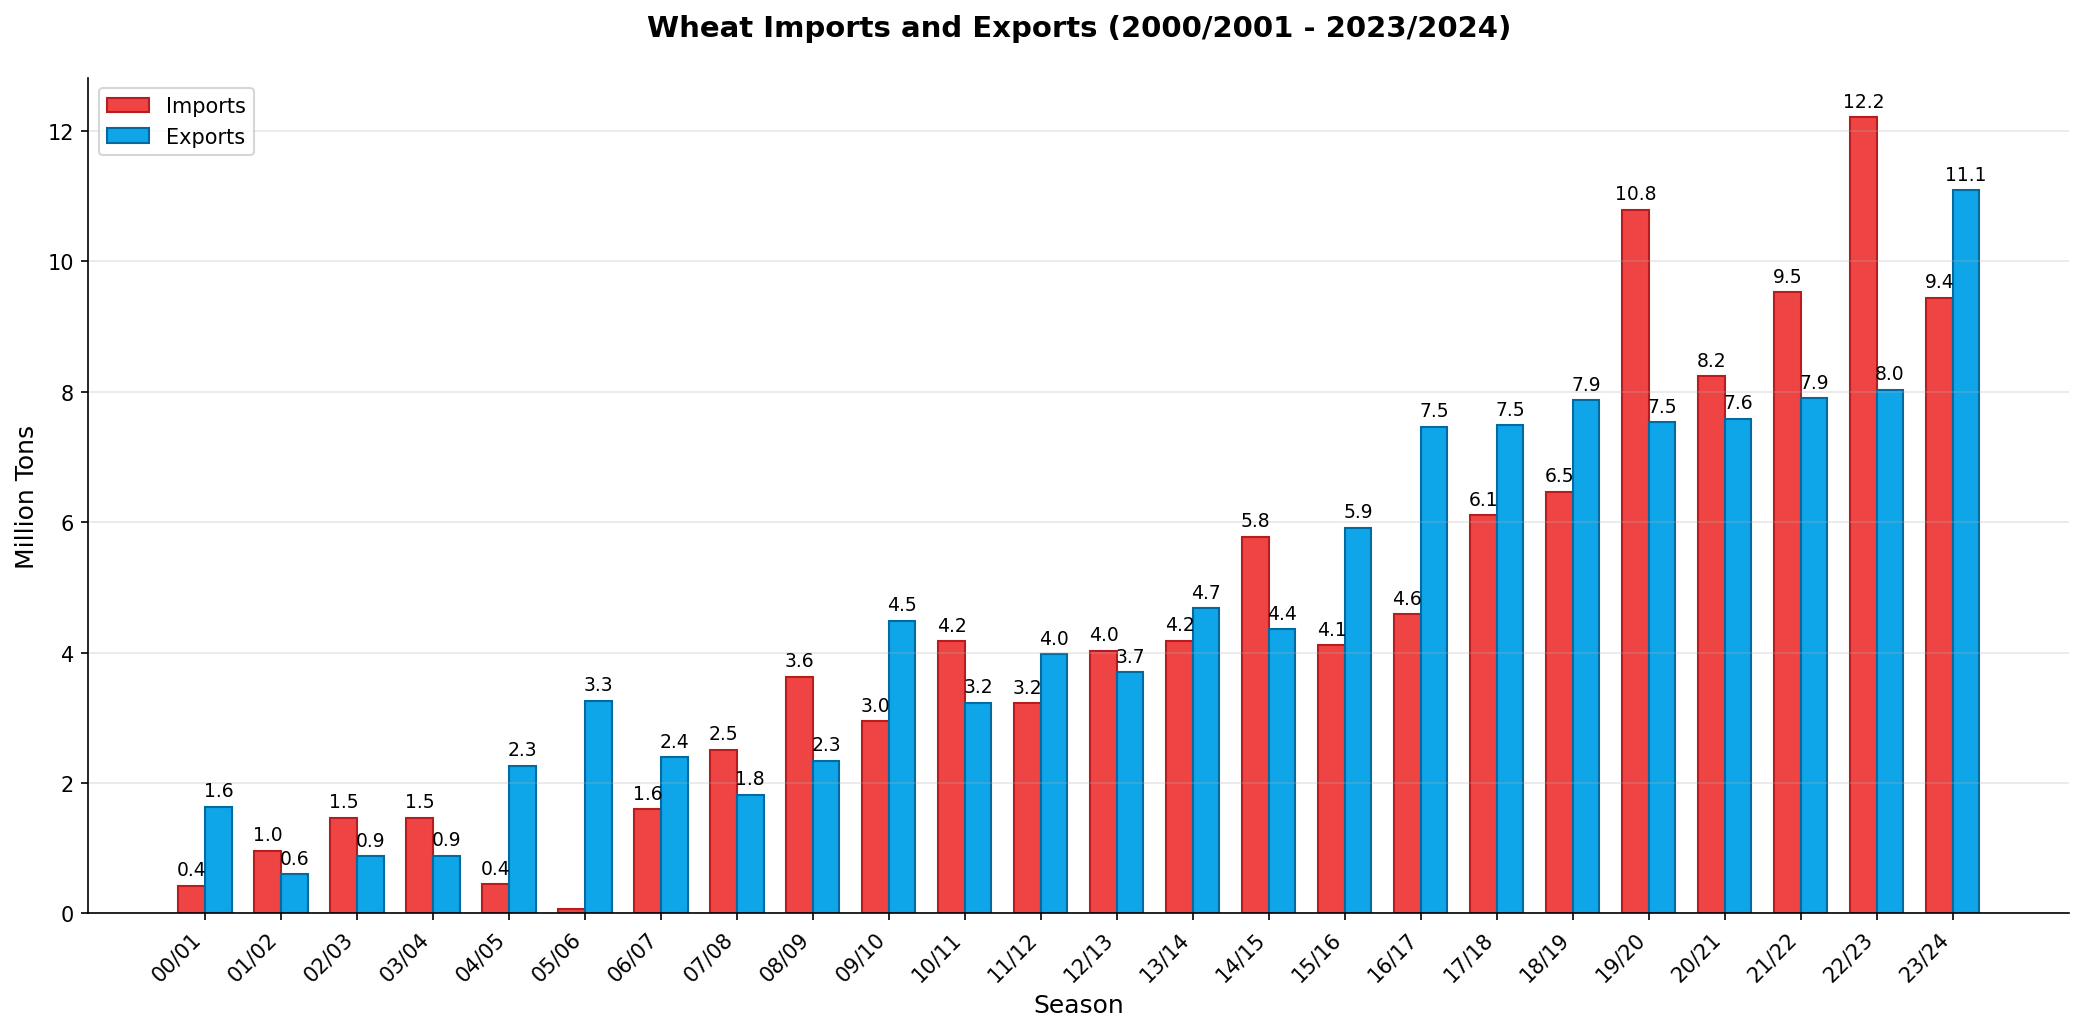
Foreign Trade: Import and Export Balance
Türkiye is both a significant importer and exporter in the wheat trade. It conducts high-volume foreign trade due to year-to-year changing climatic conditions and quality demands.
Export Figures
Türkiye has strengthened its position as a leading exporter of wheat and wheat products at both the regional and global levels during the period under review, thanks to its processing capacity, particularly in the flour and pasta industries.
Table: Türkiye Wheat Exports
Period | Export (Million Tons) |
|---|---|
2019/20 | 7.53 |
2020/21 | 7.58 |
2021/22 | 7.90 |
2022/23 | 8.03 |
2023/24 | 11.09 |
Import Figures
Türkiye's wheat imports during these periods were primarily aimed at securing the supply of high-protein bread wheat and high-quality durum wheat required by the domestic consumption and export-oriented flour and pasta industries.
Table: Türkiye Wheat Imports
Period | Import (Million Tons) | Main Reason |
|---|---|---|
2016/17 | 4.59 | Quality need |
2019/20 | 10.79 | Low production |
2020/21 | 8.24 | Balancing |
2021/22 | 9.53 | Stock need |
2022/23 | 12.21 | High demand |
2023/24 | 9.44 | Balancing |
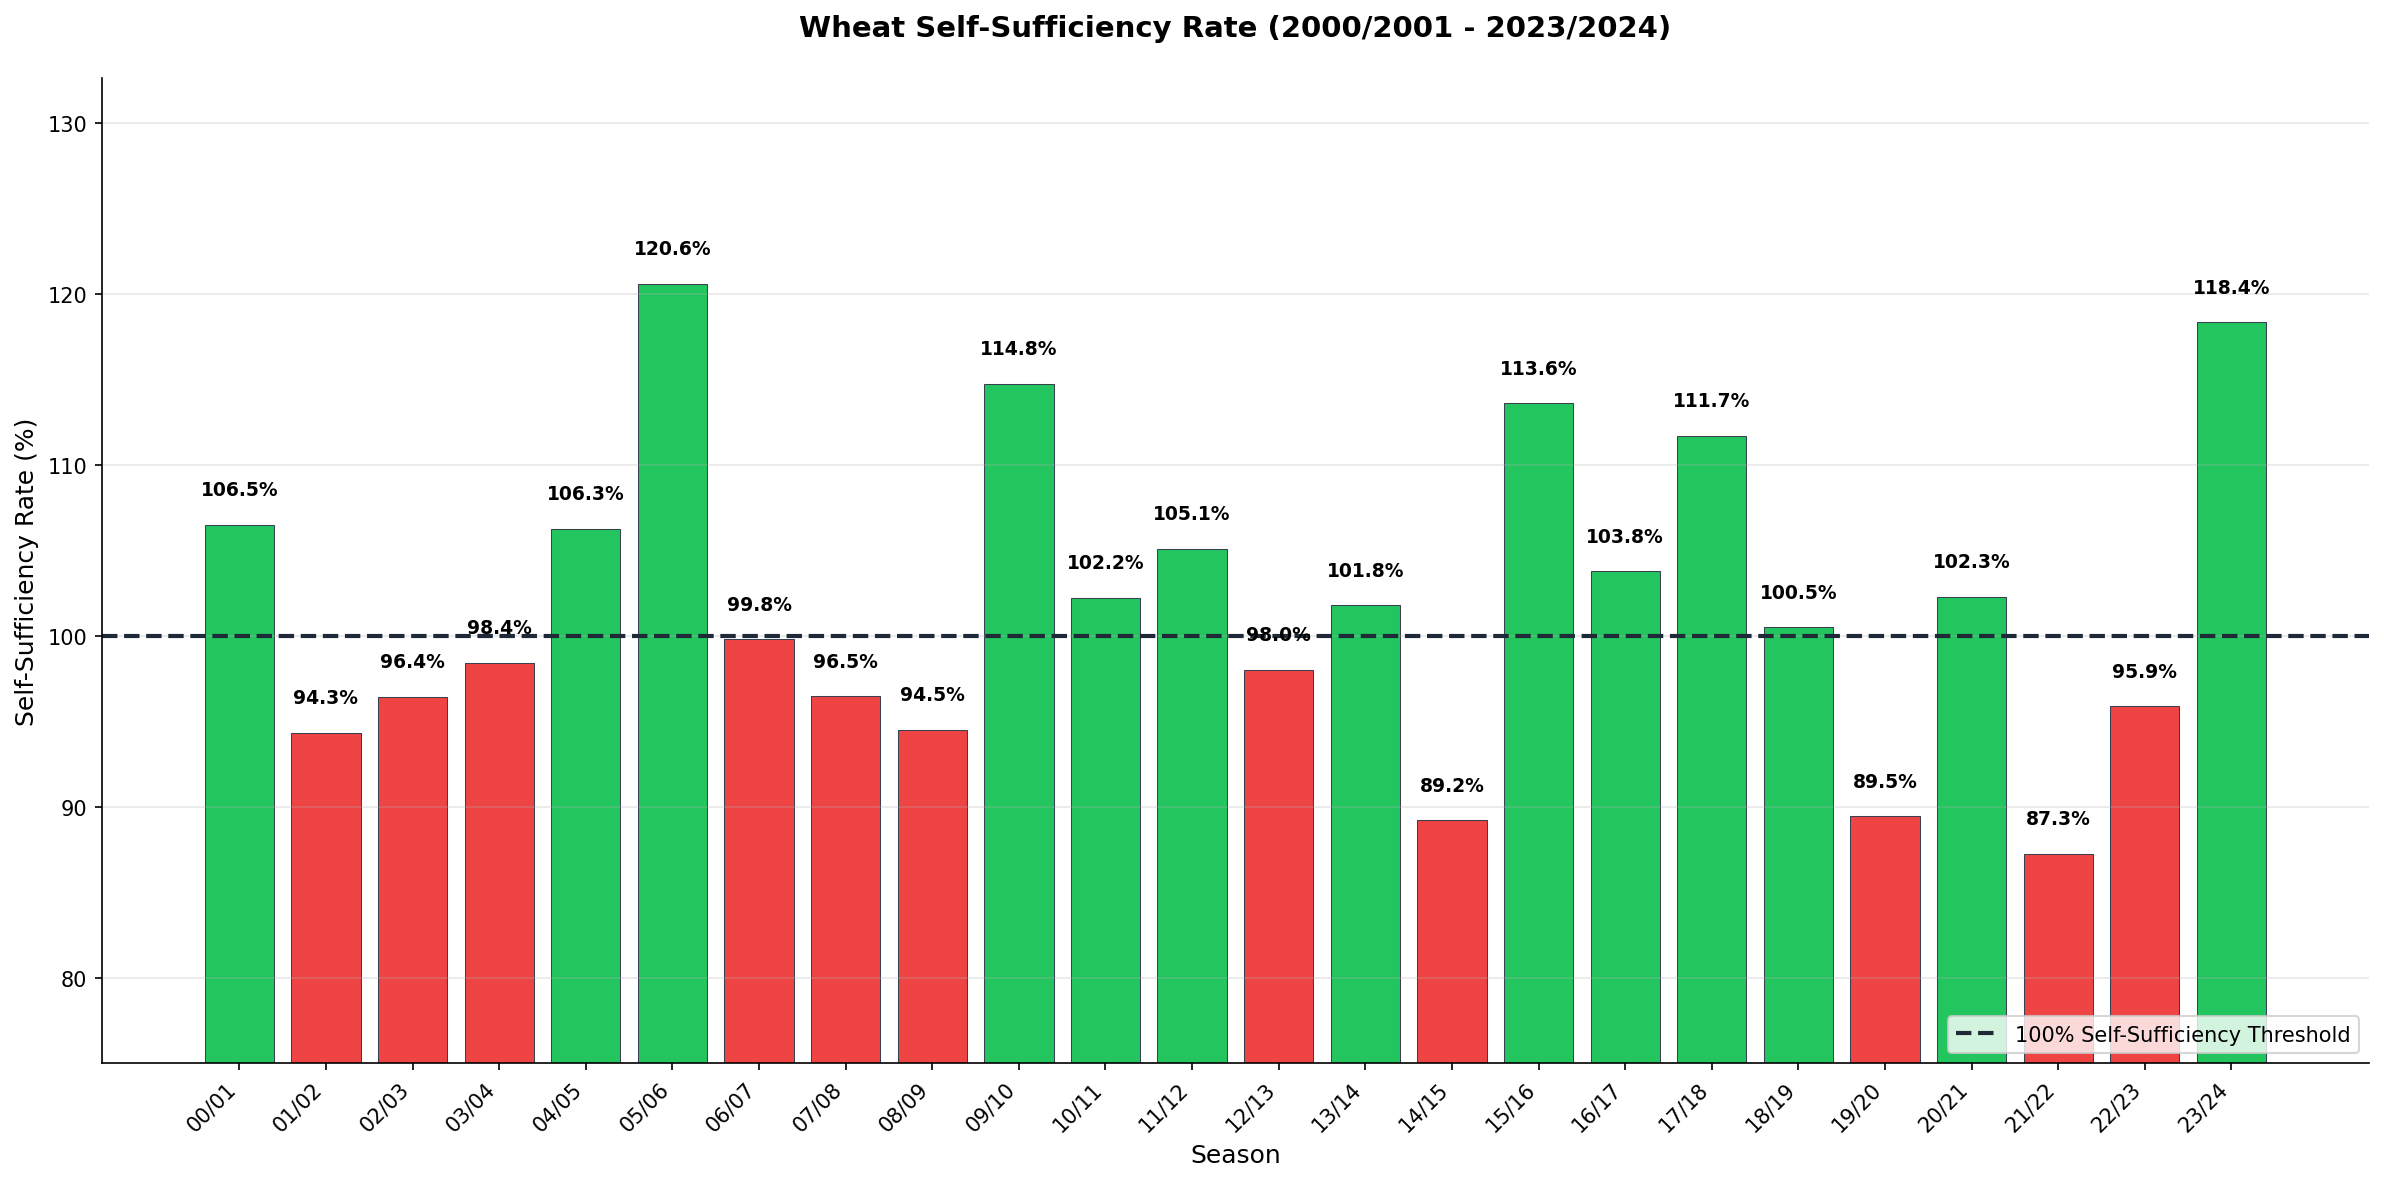
Self-Sufficiency Ratio
The self-sufficiency ratio in wheat is a critical indicator showing to what extent a country meets domestic demand with its own production. Values above 100% indicate that the country is a net exporter.
Table: Self-Sufficiency Ratio by Years
Period | Sufficiency (%) | Status |
|---|---|---|
2000/01 | 106.5% | Net Exporter ✓ |
2007/08 | 96.5% | Net Importer ✗ |
2014/15 | 89.2% | Net Importer ✗ |
2017/18 | 111.7% | Net Exporter ✓ |
2021/22 | 87.3% | Net Importer ✗ |
2023/24 | 118.4% | Net Exporter ✓ |
Effects of Climate Change on Wheat Production
Annual fluctuations in wheat production are directly related to climatic conditions.
Climate Change Risk Factors
Precipitation Irregularity: Critical lack of rainfall during sowing and development periods.
Frost Damage: Losses during the flowering period due to spring frosts.
Extreme Heat: Effect of high temperatures on yield decrease during the grain filling period.
Disease Increase: Spread of rust and other diseases with rising temperatures.
Adaptation Strategies
Drought-resistant varieties: Domestic seeds developed by the Field Crops Central Research Institute.
Irrigation investments: Expansion of agricultural irrigation projects.
Early warning systems: Meteorological risk management.
Insurance systems: Wheat insurance within the scope of TARSİM.
Table: Türkiye's Drought Periods and Effect on Wheat Production
Year | Status | Production Effect |
|---|---|---|
2007/08 | Severe Drought | 17.2M tons (low) |
2014/15 | Moderate Drought | 19.0M tons |
2021/22 | Severe Drought | 17.6M tons (low) |
Regional Production Distribution
Wheat production in Türkiye is concentrated in certain regions:
Table: Regional Distribution of Wheat Production in Türkiye
Region | Production Share (approx.) | Feature |
|---|---|---|
Central Anatolia | %32–34 | Intensive bread wheat production in dry conditions |
Southeastern Anatolia | %14–16 | High yield with irrigation, significant durum production |
Marmara | %17 | High yield, quality bread wheat |
Mediterranean | %12–13 | Early harvest opportunity, extensive irrigated areas |
Black Sea | %10 | Humid climate, bread wheat and feed grains |
Aegean | %7–8 | Bread and limited durum wheat, proximity to industry advantage |
Eastern Anatolia | %6–7 | High altitude, short and cool vegetation period |
Conclusion
The Turkish wheat sector has undergone significant transformations in the last 24 years. While production amounts fluctuate depending on climatic conditions, productivity has shown a continuous increase.
Key Findings:
22 million tons of production in the 2023/2024 season.
9.44 million tons of imports and 11.09 million tons of exports.
Self-sufficiency ratio is 118.4%, positioning the country as a net exporter.
77% of domestic use is for human consumption.
Risks stemming from climate change pose serious threats to our food security. Annual fluctuations in the self-sufficiency ratio reveal how critical climate adaptation strategies are.
For sustainable wheat production, the following should be determined and implemented as priority policies:
Development of drought-resistant domestic varieties.
Strengthening of irrigation infrastructure.
Dissemination of digital agriculture practices.
Training and support of farmers.
References
Ministry of Agriculture and Forestry, Agricultural Economics and Policy Development Institute (TEPGE). "Wheat Agricultural Product Market Reports" and "Wheat Status-Forecast Reports", various years.
Turkish Grain Board (TMO). "2020 Grain Sector Report" and "Turkey Wheat Sowing-Production-Yield and TMO Purchases" tables.
Izmir Commodity Exchange. "Wheat Sector Report 2024".
Hektaş. "In Which Region is Wheat Grown in Turkey?" (blog post, 2022/2025 updates).
Karabük University. Academic study titled "Analysis of Wheat Production by Regions in Turkey".
Aydın, A. "The Structure of Wheat Production Sector in Turkey and Future Production Forecast with ARIMA Model", Bayburt University academic journal.
Turkish Statistical Institute (TÜİK). "Crop Production Statistics, 1991–2025". TÜİK Statistics Data Portal, Agriculture – Crop Production Statistics database.