Climate Curiosity Hub
Science-based questions and answers about climate change, greenhouse gases, and sustainability
What is climate change, and how is it different from weather?
Weather refers to short-term atmospheric conditions experienced over days or weeks, while climate represents the average weather conditions of a particular region over decades or longer. Climate change is the permanent alteration of these long-term statistics due to human activities and natural processes.
Is global warming the same as climate crisis?
Global warming specifically refers to the increase in Earth's average surface temperature, primarily due to greenhouse gas emissions. Climate crisis is a broader concept that encompasses the cascading effects, risks, and urgency resulting from this warming (extreme weather events, ecosystem collapse, food and water crises, etc.).
What is the greenhouse effect, and why is it necessary?
The greenhouse effect occurs when certain gases in the atmosphere (especially water vapor, carbon dioxide, and methane) trap infrared radiation emitted from Earth's surface, causing the planet to warm. Without this natural effect, Earth's average temperature would be around -18°C instead of approximately 15°C, making life as we know it impossible.
What are greenhouse gases?
Major greenhouse gases include water vapor, carbon dioxide (CO₂), methane (CH₄), nitrous oxide (N₂O), ozone (O₃), and synthetic fluorinated gases (HFCs, PFCs, SF₆, etc.). These gases absorb and re-emit infrared radiation, contributing to heat retention in the atmosphere.
Which greenhouse gas is most responsible for global warming?
In terms of total warming effect, the most important greenhouse gas is carbon dioxide, which accounts for the largest share of human-caused emissions by volume. Although methane and nitrous oxide are much more potent per unit mass, the quantities released into the atmosphere are lower compared to CO₂.
Why is methane considered a "powerful" greenhouse gas?
Methane has a global warming potential dozens of times higher than carbon dioxide per unit mass over a given time period. Methane emissions primarily come from fossil fuel production, agriculture (especially livestock), and waste management.
What are the main sources of nitrous oxide (N₂O) emissions?
A significant portion of N₂O emissions comes from nitrogen fertilizers used in agriculture and livestock activities, with the remainder from certain industrial processes and fossil fuel combustion. Because its global warming potential is hundreds of times higher than CO₂, even small increases can have a powerful impact on climate.
Why are fluorinated greenhouse gases (F-gases) controversial?
Many fluorinated gases used in refrigeration, air conditioning, certain industrial processes, and foam insulation materials have very high global warming potentials and remain in the atmosphere for long periods. Therefore, even though their quantities are relatively small, their total warming effects can be significant, and many are subject to special regulations in climate policies.
Why is the 1.5°C warming limit considered critical?
Research shows that limiting average temperature increase to 1.5°C compared to pre-industrial times significantly reduces risks for ecosystems and societies, for example keeping the frequency and severity of extreme heat days, floods, and droughts at more manageable levels. When this threshold is exceeded, the risk of triggering irreversible damage in some ecosystems (such as large portions of coral reefs) increases markedly.
Is current progress aligned with the 1.5°C goal?
Current global emission trends indicate warming significantly above 1.5°C by the end of the century unless additional strong mitigation measures are taken. This is why many countries are attempting to rapidly reduce emissions through "net zero" emission targets, interim goals, and climate legislation.
How does climate change affect human health?
More frequent and intense heat waves increase mortality risk especially for elderly and vulnerable groups, particularly from cardiovascular and respiratory diseases. Additionally, serious health impacts occur through indirect channels such as air quality deterioration, geographic spread of vector-borne diseases, and water-food insecurity.
How is climate change affecting water resources?
Changes in precipitation patterns, glacier melting, and increased evaporation increase chronic drought risk in some regions while making extreme rainfall and flood events more frequent in others. This situation creates direct pressure on drinking water, agricultural irrigation, and hydroelectric production.
How are agriculture and food security affected by climate?
Temperature increases, precipitation changes, and extreme weather events can reduce productivity in many regions, leading to food price fluctuations and famine risk. Rain-fed agricultural systems and fragile soils are particularly vulnerable to climate shocks.
Can climate change lead to migration and security issues?
Rising sea levels, prolonged droughts, and increasing disasters can strain living conditions in some regions, increasing internal and external migration pressure. These migration movements can create pressure on infrastructure, labor markets, and social cohesion, potentially triggering security discussions.
How does climate change threaten biodiversity?
Rapid changes in temperature and precipitation patterns are shifting or destroying habitats that species are adapted to, increasing ecosystem degradation and species extinction risk. Coral reefs, polar ecosystems, and mountainous areas are among the most vulnerable regions to climate change.
How is deforestation linked to climate?
Forests are sink areas that store large amounts of carbon; when they are cut or burned, both this storage capacity is lost and additional CO₂ is released into the atmosphere. Deforestation also changes the water cycle and local temperatures that affect regional climate.
What is the main cause of sea level rise?
Two main mechanisms: thermal expansion of ocean waters due to warming, and land ice and ice sheets melting and adding fresh water to the seas. These processes increase coastal erosion and put deltas, island nations, and low-lying coastal cities at risk.
What does renewable energy mean?
Renewable energy refers to energy obtained from sources that continuously renew themselves through natural processes on short time scales; solar, wind, hydroelectric, geothermal, and biomass fall into this category. These sources have much lower greenhouse gas emissions compared to fossil fuels.
Why is increasing renewable energy use important for climate?
Replacing fossil fuels with renewable sources in electricity, heating-cooling, and transportation can significantly reduce CO₂ emissions from the energy sector. This constitutes one of the fundamental pillars of emission reduction consistent with 1.5–2°C targets.
Is there a difference between clean energy and renewable energy?
"Clean energy" typically refers to all technologies with very low greenhouse gas and air pollutant emissions (including some nuclear and low-carbon solutions), while "renewable energy" is based only on naturally renewing sources. Therefore, all renewable energy is also low-carbon, but not all low-carbon technology is necessarily renewable.
Can biomass and biogas really be considered "carbon neutral"?
Biomass energy is based on the principle that carbon absorbed from the atmosphere during plant growth returns to the atmosphere during combustion or decomposition; if sustainable production and land management are ensured, net emission reduction is possible. However, when land use changes, fertilizer use, and fossil fuel use in the supply chain are taken into account, not every biomass project can be called "carbon neutral"; project-based evaluation is necessary.
What does "net zero" emissions mean?
Net zero is the state where the amount of greenhouse gases released into the atmosphere by human activities is balanced in the long term by the amount removed from the atmosphere through sinks and technological solutions. At this point, atmospheric greenhouse gas concentrations stabilize and global temperature increase tends to halt.
What is the difference between being carbon neutral and climate positive?
Carbon neutrality refers to reducing an activity or organization's net greenhouse gas impact to zero, while the climate positive (or carbon positive) approach aims to remove more greenhouse gases from the atmosphere than it emits. Climate positivity typically requires additional measures such as additional afforestation, carbon capture, and negative emission technologies.
What is carbon pricing and how does it work?
Carbon pricing means taxing emissions at a specific cost per ton (carbon tax) or pricing through tradable permits within a total emission cap (emission trading systems). These mechanisms aim to make polluters pay and economically incentivize transition to low-carbon technologies.
What does climate change adaptation mean?
Adaptation is the process by which societies, ecosystems, and economies adjust themselves to reduce damage or capitalize on opportunities against unavoidable climate impacts. For example, flood barriers, drought-resistant seeds, early warning systems, and urban planning adapted to heat waves are examples of adaptation measures.
How can cities adapt to climate change?
Cities can become more resilient to climate impacts by increasing green infrastructure, reducing flood risk with permeable surfaces and water management solutions, using designs that reduce heat island effect, and implementing disaster risk management plans. Increasing energy efficiency in transportation and buildings both reduces emissions and increases resilience to extreme heat and cold.
In which areas can I reduce my carbon footprint the most individually?
The biggest impact is typically seen in four areas: energy efficiency and renewable electricity use in homes, low/zero emission options in transportation choices, reducing consumption of meat and dairy products and preventing waste in diet, and choosing long-lasting, repairable products in consumption habits. Additionally, supporting low-carbon projects through financial choices (savings, investments, pension funds) is also an indirect but important lever.
Where should companies start when preparing a climate strategy?
First, it is necessary to clarify the current emission profile by conducting a scope 1, 2, and 3 greenhouse gas inventory; then science-based reduction targets should be set and a roadmap prepared in areas such as energy efficiency, renewable energy, and low-carbon product-service design. Supply chain management, integration of climate risks into financial reporting, and transparent reporting are also fundamental components of corporate climate strategy.
How reliable are carbon footprint calculation tools?
Tools based on general methodologies founded on international standards and national guidelines (developed based on IPCC guides, ISO standards, etc.) can provide reasonably accurate estimates, but results are sensitive to data quality and assumptions used. At the corporate level, verification and independent audit mechanisms are important to increase the reliability of calculations.
What is Carbon Capture and Storage (CCS)?
Carbon Capture and Storage (CCS) is the process of capturing carbon dioxide (CO₂) emissions from industrial facilities and fossil fuel power plants before they are released into the atmosphere, transporting them, and permanently storing them in deep underground geological formations. CCS is a critical mitigation tool especially in sectors where emission reduction is difficult, such as cement, chemical, and steel production.
What is the difference between CCS and CCUS?
CCS (Carbon Capture and Storage) refers to permanently storing captured CO₂ underground. CCUS (Carbon Capture, Utilization and Storage) adds utilization: using captured CO₂ in industrial processes (synthetic fuels, building materials, chemical production). Utilization can delay or prevent atmospheric release. However, many utilization methods eventually release CO₂ back into the atmosphere; only long-term storage (geological storage) provides permanent climate benefits. CCUS is seen as a way to create economic value from carbon.
How efficient is CCS technology?
Modern CCS systems can capture 85-95% of CO₂ from industrial sources. However, the capture process itself is energy-intensive, consuming 10-40% of power plant output (parasitic load). Total system efficiency depends on: capture method (post-combustion, pre-combustion, oxy-fuel), energy source, and transport-storage distance. As technology improves and scales, costs and energy penalties are expected to decrease. CCS is considered more feasible for large point sources (power plants, cement factories) than distributed sources (transportation).
Is CCS storage safe?
Geological CO₂ storage is considered safe when sites are properly selected and monitored. Storage sites include: depleted oil/gas fields, deep saline aquifers, unmineable coal seams. Risks include: leakage (very low with proper site selection), induced seismicity (rare, small magnitude). The IPCC states that well-selected and managed sites can retain 99% of CO₂ for over 1,000 years. Ongoing monitoring (pressure, seismic, satellite) is essential. Global CCS projects (Norway Sleipner, Canada Boundary Dam) demonstrate safe long-term operation.
What is the cost of CCS?
CCS costs vary widely: $50-120 per ton CO₂ for power plants, $20-80 for industrial facilities with high-purity CO₂ streams. Costs depend on: capture technology, CO₂ concentration, transport distance, storage site geology. Direct Air Capture (DAC), which removes CO₂ from ambient air, costs $200-600/ton, currently much higher. Policy support (carbon pricing, tax credits like US 45Q) is essential for economic viability. As technology scales and improves, costs are expected to decrease significantly by 2030-2050.
What is circular economy and how does it work?
Circular economy is a regenerative economic model where waste is eliminated, resources are kept in circulation, and nature is regenerated. This system aims to extend product life cycles as much as possible through reprocessing, reuse, repair, and recycling of existing materials and resources. Approximately 67% of global greenhouse gas emissions are related to material management, and circular economy has the potential to close about half of the emission gap between current policies and the 1.5°C target.
What are the basic principles of circular economy?
The Ellen MacArthur Foundation defines 3 core principles: 1) Design out waste and pollution - Products designed for durability, repairability, and reuse; 2) Keep products and materials in use - Extend lifecycles through repair, remanufacturing, recycling; 3) Regenerate natural systems - Return nutrients to soil, restore biodiversity. The circular economy model contrasts with the linear "take-make-dispose" model. It applies at all scales: product design, business models, city planning, national policy.
How does circular economy reduce emissions?
Circular economy reduces emissions through: 1) Material efficiency - Using less virgin material reduces extraction and processing emissions (e.g., recycled aluminum uses 95% less energy than primary production); 2) Extended product life - Reduces manufacturing demand; 3) Waste prevention - Eliminates landfill/incineration emissions; 4) Industrial symbiosis - One industry's waste becomes another's input. A study estimates circular economy strategies could reduce global emissions by 45% by 2050, complementing renewable energy transition.
What is the difference between recycling and circular economy?
Recycling is just one tool within circular economy. Circular economy prioritizes: 1) Refuse/Rethink - Do we need this product? 2) Reduce - Use less; 3) Reuse - Multiple use cycles; 4) Repair - Extend lifespan; 5) Refurbish/Remanufacture - Restore to like-new; 6) Recycle - Material recovery (last resort); 7) Recover energy - Incineration (least preferred). Recycling addresses end-of-life, while circular economy redesigns entire systems to eliminate waste from the start. "Reduce" and "reuse" are higher priorities than recycling.
What are circular economy examples in business?
Product-as-a-service (PaaS): Philips lighting leases light as a service, maintains ownership, recovers materials. Sharing platforms: Airbnb, car-sharing reduce production need. Design for disassembly: Fairphone modular design allows easy repair and component replacement. Industrial symbiosis: Kalundborg, Denmark - multiple industries exchange heat, water, materials. Fashion: Patagonia Worn Wear resells used clothing. These models shift from "selling products" to "delivering value," aligning profitability with resource efficiency.
Are electric vehicles carbon neutral?
Electric vehicles are not completely carbon neutral, but they produce significantly less greenhouse gas emissions compared to traditional gasoline and diesel vehicles. Throughout their entire life cycle (from raw material extraction to vehicle and battery production and recycling), electric vehicle greenhouse gas emissions are significantly lower than fossil fuel-powered equivalent vehicles. A 2020 study confirmed that the average EU life cycle climate impact for a mid-low range battery electric vehicle (BEV) is approximately 45% of a gasoline vehicle and 53% of a diesel vehicle.
Are electric vehicles cleaner than conventional vehicles?
Yes, even when electricity grid emissions are considered. In countries with coal-heavy grids, EVs still produce ~30-50% less lifecycle emissions than gasoline vehicles. In grids with high renewable energy penetration (Norway, Iceland, France), EVs emit 70-90% less. As grids decarbonize, EV emissions will further decrease without changing the vehicle. Additionally, EVs have zero tailpipe emissions, improving urban air quality. Overall, EVs are cleaner today and will become increasingly cleaner as electricity generation shifts to renewables.
How significant are battery production emissions?
Battery production contributes 30-40% of an EV's total lifecycle emissions (vs. ~20% for manufacturing a gasoline car). Lithium-ion batteries are energy-intensive to produce, requiring mining (lithium, cobalt, nickel) and refining. However, over the vehicle's life, EVs recover this "carbon debt" within 1-3 years of driving. Improvements: Battery production emissions are decreasing through renewable energy use in factories (Tesla Gigafactory), improved efficiency, and recycling. Future solid-state batteries may further reduce environmental impact.
What are the lifecycle emissions of EVs vs gasoline vehicles?
Lifecycle emissions (g CO₂e/km, average): Gasoline car: ~250-300, Battery EV (EU average grid): ~100-150, BEV (renewable electricity): ~50-70. Even in the worst case (coal-heavy grid), BEV lifecycle emissions are ~150-200 g/km, still better than gasoline. Key factors: 1) Grid carbon intensity (biggest variable), 2) Battery size (larger batteries = more production emissions), 3) Vehicle efficiency, 4) Driving distance (longer use amortizes production emissions). As grids decarbonize, EV advantages grow.
How do EVs impact air quality?
EVs have zero tailpipe emissions, eliminating local pollution (NOx, PM2.5, CO) that causes respiratory diseases, heart disease, and premature death. Urban air quality benefits are immediate and significant. However, EVs still produce tire and brake wear particles (though regenerative braking reduces brake wear ~50%). Grid emissions occur at power plants, often away from population centers and subject to pollution controls. Overall, EVs dramatically improve urban air quality, providing co-benefits beyond climate mitigation.
What is Climate-Smart Agriculture (CSA)?
Climate-Smart Agriculture (CSA) is an integrative approach aimed at ensuring food security in the face of climate change. CSA combines three main objectives: (1) sustainably increasing agricultural productivity, (2) building resilience of food systems and safety nets, and (3) reducing greenhouse gas emissions from agriculture. Regenerative agriculture practices can reduce greenhouse gas emissions, improve soil health, and make communities more resilient to climate change.
What are the benefits of regenerative agriculture?
Regenerative agriculture goes beyond sustainability to actively improve ecosystems. Benefits: 1) Soil carbon sequestration - Builds organic matter, stores CO₂; 2) Improved soil health - Increases water retention, nutrient cycling, microbial diversity; 3) Reduced inputs - Less need for synthetic fertilizers and pesticides; 4) Biodiversity - Supports pollinators and beneficial insects; 5) Resilience - Better withstands droughts and extreme weather. Practices include: cover cropping, no-till farming, diverse crop rotations, integrated livestock grazing, composting.
How does soil health relate to climate?
Healthy soils are carbon sinks: globally, soils store ~2,500 Gt carbon, 3x more than the atmosphere. Degraded soils release carbon; healthy soils sequester it. Soil organic matter (SOM) improves: water retention (drought resilience), nutrient availability (reduces fertilizer need), structure (prevents erosion). Agricultural practices impact soil carbon: Degrading (conventional tillage, monoculture, bare soil); Building (no-till, cover crops, compost, agroforestry). Increasing soil organic carbon by just 0.4% annually could offset all fossil fuel emissions (ambitious but illustrates potential).
How can agriculture reduce emissions?
Agriculture contributes ~24% of global GHG emissions. Reduction strategies: 1) Reduce N₂O from fertilizers - Precision application, slow-release formulas, nitrification inhibitors; 2) Manage CH₄ from rice - Alternate wetting/drying, improved varieties; 3) Livestock - Feed additives, manure management, selective breeding; 4) Reduce deforestation - Stop clearing forests for agriculture; 5) Carbon sequestration - Agroforestry, cover crops, improved grazing. The Food and Land Use Coalition estimates sustainable agriculture could reduce emissions by 8-10 Gt CO₂e/year.
What is agroforestry and its climate impact?
Agroforestry integrates trees and shrubs into agricultural systems: alley cropping (crops between tree rows), silvopasture (trees + pasture + livestock), forest farming (crops/animals under forest canopy). Climate benefits: 1) Carbon sequestration in tree biomass and soil, 2) Reduced emissions from fertilizers (trees fix nitrogen), 3) Increased resilience to extreme weather, 4) Biodiversity habitat. Agroforestry systems can sequester 2-9 tons CO₂/ha/year while maintaining food/timber production. Widely practiced in tropics, gaining interest in temperate regions.
What is a green building?
A green building is one that "reduces or eliminates negative impacts on our climate and natural environment - and can create positive impacts." Green buildings encompass energy efficiency, water use, indoor air quality, material selection, and building design. 85% of buildings in the EU were built before 2000 and 75% have poor energy performance; therefore, improving the energy performance of existing buildings is key to saving energy and achieving a zero-emission building stock by 2050.
How are energy-efficient buildings designed?
Energy-efficient building design integrates: 1) Passive design - Orientation for natural light/heating, thermal mass, natural ventilation, shading; 2) Building envelope - High-performance insulation, triple-glazed windows, airtight construction; 3) Efficient systems - Heat pumps, LED lighting, smart HVAC controls; 4) Renewable energy - Solar PV, solar thermal, geothermal; 5) Smart technology - Building management systems, occupancy sensors. Passive House standard achieves 90% heating/cooling reduction vs. conventional buildings. "Net zero energy buildings" produce as much energy as they consume.
What is building energy performance?
Building energy performance measures energy use per square meter per year (kWh/m²/year). Typical ranges: Conventional building: 150-300, Efficient building: 50-100, Passive House: <15, Net Zero: 0 (net annual). Performance depends on: climate, building type, occupancy, systems. Energy Performance Certificates (EPCs) rate buildings A-G in many countries. Poor performers waste money and emit more. EU aims for all new buildings to be "nearly zero energy" and retrofitting existing stock is a priority.
What is the difference between ENERGY STAR and green building certifications?
ENERGY STAR (US EPA) focuses purely on energy efficiency; products/buildings meeting strict efficiency criteria earn the label. Green building certifications (LEED, BREEAM, Green Star) are comprehensive, evaluating: energy, water, materials, indoor environment, site selection, innovation. LEED (Leadership in Energy and Environmental Design) awards points across categories; Platinum is highest. BREEAM (UK) assesses sustainability across building lifecycle. Green certifications go beyond energy to holistic sustainability. ENERGY STAR can contribute points toward green certification.
How do solar panels benefit buildings?
Solar PV on buildings provides: 1) Clean electricity - Reduces grid dependence and emissions; 2) Cost savings - Free energy after payback (5-10 years), offsetting high electricity costs; 3) Grid support - Excess energy fed to grid (net metering); 4) Resilience - Backup power with battery storage; 5) Property value - Green buildings command higher prices/rents. Rooftop solar is especially valuable in sunny climates with high electricity costs. Building-integrated PV (BIPV) incorporates solar into facades, windows, roofing materials. Commercial buildings with large flat roofs are ideal for solar.
How does biodiversity loss affect climate change?
Biodiversity loss intensifies the climate crisis because functional ecosystems absorb a large portion of human-caused CO₂ emissions. Forests store significant amounts of carbon; however, if forest areas are destroyed through deforestation, this captured carbon is released as CO₂. Peatlands and mangrove forests normally act as carbon sinks, but if they are degraded, they can no longer perform this function. Economic value corresponding to more than half of global economic output in terms of GDP is potentially at risk as a result of biodiversity loss.
How does climate change threaten biodiversity?
Climate change threatens species through: 1) Habitat loss - Shifting climate zones force species to migrate or face extinction; polar/alpine species have "nowhere to go"; 2) Phenology mismatches - Species lifecycles (migration, breeding, flowering) out of sync with food sources; 3) Ocean impacts - Coral bleaching from warming, ocean acidification harming shellfish; 4) Extreme events - Droughts, fires, storms destroy habitats; 5) Range shifts - Invasive species expand, native species decline. IPCC warns 1.5°C warming puts 20-30% of species at extinction risk; at 2°C, 30-40%.
What are ecosystem services?
Ecosystem services are benefits humans derive from nature: 1) Provisioning - Food, water, timber, medicine; 2) Regulating - Climate regulation (carbon storage), water purification, flood control, pollination; 3) Cultural - Recreation, spiritual value, tourism; 4) Supporting - Nutrient cycling, soil formation, primary production. Economic value: ~$125 trillion/year, dwarfing global GDP. Climate-related services: forests store 296 Gt carbon, wetlands filter water and buffer storms, mangroves protect coasts. Biodiversity loss degrades these services, threatening human well-being.
How do forests and wetlands act as carbon sinks?
Forests: Trees absorb CO₂ through photosynthesis, storing carbon in biomass (trunk, branches, roots) and soil. Tropical rainforests, boreal forests, and temperate forests collectively store ~861 Gt carbon. Deforestation releases this carbon. Forest protection/restoration is a key climate solution. Wetlands: Peatlands, mangroves, salt marshes accumulate organic matter in waterlogged, low-oxygen conditions, preventing decomposition. Peatlands cover 3% of land but store 30% of soil carbon (~600 Gt). Draining/burning peatlands releases massive CO₂. "Blue carbon" (coastal wetlands) sequesters carbon 40x faster than forests.
How does biodiversity conservation contribute to climate action?
Biodiversity conservation is climate action: 1) Carbon sequestration - Protecting/restoring forests, wetlands, grasslands; 2) Resilience - Diverse ecosystems better withstand climate shocks; 3) Nature-based solutions - Mangrove restoration protects coasts and stores carbon; 4) Sustainable livelihoods - Reducing deforestation pressure. The 30x30 goal (protect 30% of land/ocean by 2030) addresses both biodiversity and climate crises. "Nature-positive" approaches recognize climate and biodiversity are interconnected; solutions must address both. Indigenous land management has protected biodiversity and carbon stocks for millennia.
What is a green bond?
Green bonds are fixed-income instruments specifically designed to finance environmental projects. The climate flows market reached $1.46 trillion in 2022. Green bonds are like other conventional bonds except that the issuer promises to use the proceeds for green investments, green projects, or refinanced eligible green assets. Green bond projects must follow strict frameworks consistent with established standards such as the Green Bond Principles and Climate Bonds Taxonomy.
How do green bonds differ from conventional bonds?
There is no difference between green bonds and conventional bonds except that green bond proceeds are used to finance environmental projects. However, this specific feature invites increased scrutiny regarding transparency. Green bond pricing typically shows lower interest rates compared to conventional bonds from the same issuer; studies show yields at issuance are 10-45 basis points lower on average. This pricing advantage stems from strong demand for sustainable investments.
Who can issue green bonds?
Any government or business entity that can issue bonds can also issue green bonds. Additionally, a banking institution can raise long-term funds using green bonds as a financial instrument. Green bond issuers include sovereigns (countries), sub-sovereigns (cities, states), financial institutions, and corporations. The green bond market has grown exponentially in recent years, triggered by increasing awareness among investors who are more willing to buy sustainable products.
What are the Green Bond Principles (GBP)?
The Green Bond Principles (GBP) are voluntary process guidelines that recommend transparency and disclosure to promote integrity in the development of the green bond market. The GBP has four core components: use of proceeds, project evaluation, management of proceeds, and reporting. This standardized framework has facilitated market growth by creating clear guidelines for issuers and building investor confidence through increased transparency and accountability.
How are green bonds used for climate adaptation?
Green bonds can be used to raise necessary financing for climate adaptation and resilience investments by tapping capital markets. The Green Bonds for Climate Resilience Guide provides practical guidance to issuers of all types on how to raise capital in the green bond market for investing in climate adaptation and resilience. Green bonds can finance adaptation projects such as flood barriers, drought-resistant infrastructure, and early warning systems.
What is the difference between carbon credits and carbon offsets?
Carbon credits (carbon allowances) work like permits for emissions; when a company buys carbon credits, typically from the government, it gains permission to produce one ton of CO₂ emissions. Carbon offsets involve investing in projects that reduce or remove greenhouse gases from the atmosphere to compensate for emissions produced elsewhere. Carbon offsetting helps reduce emissions, carbon credits help prevent them. Carbon offsetting is a voluntary action by a company, while carbon credits are a regulatory requirement.
How do cap-and-trade systems work?
Cap-and-trade systems set a total emission cap for a region or sector and issue or allocate allowances to emitters. These allowances are regulated under a declining cap, creating tighter requirements. Emitters can trade allowances with each other, with those having lower emission costs selling to those with higher costs. The EU ETS (European Union Emissions Trading System) is the world's largest carbon market, covering electricity, heating, aviation, and large industrial emitters across 27 EU countries.
What criteria determine high-quality carbon credits?
High-quality carbon credits must meet these criteria: 1) Additionality - Reductions would not occur without the credit; 2) Permanence - Carbon storage is long-lasting; 3) Leakage prevention - Reducing emissions in one place doesn't cause increases elsewhere; 4) Verifiable measurement - Robust methodology and third-party verification; 5) Avoiding double-counting - Each credit is claimed only once. The ICVCM (Integrity Council for Voluntary Carbon Market) Core Carbon Principles work to establish these standards.
Why are Nature-based Climate Solutions (NCS) important?
Nature-based Climate Solutions (NCS) refer to actions to mitigate climate change through protecting, managing, and restoring natural ecosystems. NCS include forest management, restored wetlands, improved soil health. Research shows NCS can provide approximately 37% of the global emission reductions needed by 2030. These solutions also provide co-benefits such as biodiversity conservation, improved water quality, and flood control. However, it's important to note that NCS should complement, not replace, fossil fuel emission reductions.
What is the greenwashing risk in carbon offset projects?
Greenwashing means companies exaggerating their environmental impacts or sustainability efforts. In carbon offsets, greenwashing risks include: purchasing low-quality or unverified credits, exaggerating emission reductions, non-permanent carbon storage, and lack of additionality. One study found that a large portion of major forest carbon offsets provide no real climate benefit. Companies should be transparent in justifying offset use and prioritize emission reduction. The Oxford Offsetting Principles provide a framework for offset use.
What are Scope 1, 2, 3 emissions?
Scope 1 covers direct emissions from sources owned or directly controlled by an organization (vehicle fleet, fuel burning in facilities). Scope 2 accounts for indirect emissions from purchased energy production (electricity, steam, heating, cooling). Scope 3 includes all other indirect emissions the company is responsible for throughout its value chain (purchased goods and services, business travel, employee commuting, use of sold products). Scope 3 can represent more than 90% of a company's total emissions.
How are Scope 1 emissions calculated?
Scope 1 emissions are calculated by collecting direct fuel consumption data and multiplying by appropriate emission factors. For example: diesel burned in your vehicle fleet, natural gas use, generators in facilities. The GHG Protocol provides standard emission factors for each fuel type. Accurate calculation of Scope 1 is critical for understanding emissions the company can directly control and identifying reduction opportunities.
What are location-based and market-based methods in Scope 2?
There are two calculation methods for Scope 2: The location-based method uses the average emission factor of the electricity grid. The market-based method considers the company's specific electricity purchase contracts (green energy certificates, PPAs). Companies purchasing renewable energy can zero out Scope 2 emissions with the market-based method. The GHG Protocol Scope 2 Guidance recommends reporting both methods.
What are the 15 categories of Scope 3 emissions?
The GHG Protocol divides Scope 3 into 15 categories: Upstream (1-8): Purchased goods and services, capital goods, fuel and energy-related activities, upstream transport, waste generated in operations, business travel, employee commuting, leased assets. Downstream (9-15): Downstream transport, processing of sold products, use of sold products, end-of-life of sold products, franchises, investments. Each category has specific calculation methodologies.
Why are Scope 3 emissions difficult to reduce?
Scope 3 emissions are difficult to reduce because they are outside the company's direct control. The supply chain can contain hundreds of suppliers, data collection is complex, influencing how customers use products is limited. However, Scope 3 cannot be ignored as it constitutes most total emissions (70-90%). Solutions: supplier collaboration, improvements in product design, customer education, using platforms like the CDP Supply Chain program. SBTi requires companies to set Scope 3 targets.
What is Life Cycle Assessment (LCA)?
Life Cycle Assessment (LCA) is a standardized approach that evaluates the environmental impact of a product, service, or system throughout its entire life cycle - from raw material extraction to disposal. LCA consists of four phases: goal and scope definition, life cycle inventory analysis, life cycle impact assessment, and interpretation. LCA evaluates multiple environmental impact categories such as climate change, water use, resource depletion, and acidification, and is the cornerstone of sustainability strategy.
What is Cradle-to-grave LCA?
Cradle-to-grave LCA covers all stages from raw material extraction ("cradle") to the product's end-of-life disposal ("grave"). These stages include: raw material extraction and processing, manufacturing, packaging, distribution and transport, use phase, end-of-life (recycling, landfill, incineration). The cradle-to-grave approach provides a comprehensive view for understanding a product's true environmental cost and identifying improvement opportunities.
How are system boundaries determined in LCA?
System boundaries define which processes and activities are included in the LCA. Boundaries: Cradle-to-grave (raw material to disposal), Cradle-to-gate (raw material to factory gate), Gate-to-gate (one production stage to another). Boundary determination depends on study objectives, data availability, and resources. ISO 14040/14044 standards require system boundaries to be clearly defined and justified. Cut-off criteria allow neglecting small contributions.
What is a functional unit and why is it important?
The functional unit is the measurement unit defining the performance of a product or service in LCA. For example: "illuminating a room for 10 years" or "transporting one passenger 1 km". The functional unit enables fair comparison of different products. In LED bulb vs. incandescent bulb comparison, the entire life cycle is examined for the same lighting service, not just production emissions. A poorly defined functional unit can lead to misleading results.
How are LCA results interpreted and used?
LCA results provide quantitative data across environmental impact categories (climate change, water use, toxic effects, etc.). Results are used for: hotspot analysis (identifying where the biggest impacts come from), scenario comparisons (evaluating different design options), continuous improvement (tracking progress over time). Companies use LCA for product design, supplier selection, marketing claims, and sustainability reporting. EPD (Environmental Product Declaration) and Carbon Footprint labels are based on LCA.
What is Science Based Targets initiative (SBTi)?
Science Based Targets initiative (SBTi) ensures that companies' emission reduction targets are consistent with Paris Agreement goals - keeping global warming well below 2°C compared to pre-industrial levels and limiting it to 1.5°C. The SBTi standard requires companies to reduce operational and supply chain emissions to a level consistent with 1.5°C pathways at the global or sector level. Targeting net zero by 2050 at the latest is crucial; this gives us a 50% chance of limiting global warming at relatively safe levels.
What are the SBTi target-setting criteria?
SBTi requires companies to reduce Scope 1 and 2 emissions by at least 4.2% annually (for 1.5°C pathway). If Scope 3 emissions constitute more than 40% of total emissions, separate Scope 3 targets are mandatory. Targets should cover a 5-10 year timeframe. Long-term targets (net zero) should aim for 2050 at the latest. SBTi does not count offsets toward near-term targets; real emission reduction is required. Targets must be disclosed in CDP, GRI, or integrated reports.
What are the requirements of the SBTi Net-Zero Standard?
The SBTi Net-Zero Standard (launched in 2021) ensures companies reach net zero emissions across their value chains by 2050. Requirements: 1) Near-term (5-10 year) science-based targets, 2) Long-term (2050) science-based targets, 3) 90%+ reduction for all emissions including Scope 3, 4) Neutralization: carbon dioxide removal (CDR) for remaining emissions, 5) Beyond value chain emission reduction investments. Offsets are encouraged during transition but not included in net zero definition.
How does the SBTi target validation process work?
Companies send a target commitment letter to SBTi (publicly announced). They must develop and submit targets within 24 months. The SBTi technical team evaluates targets for criteria compliance. The validation process takes 30 days. Approved targets are published on the SBTi website. Companies must report annual progress. If targets are not met or methodology is violated, SBTi can remove the company from the list. Over 7,000 companies have committed to SBTi, with over 4,000 validated.
What differentiates SBTi from other climate commitments?
SBTi stands apart from other voluntary commitments because it is aligned with climate science (IPCC scenarios). "Carbon neutral" or "net zero" claims can rely on offsets; SBTi requires real emission reduction. Initiatives like RE100 (renewable electricity) and EP100 (energy efficiency) complement SBTi. CDP encourages companies to set SBTi targets. Investors view SBTi-validated targets as the "gold standard". SBTi provides rigorous verification to prevent greenwashing.
What are climate adaptation efforts in Türkiye?
Türkiye is among the most vulnerable countries to climate change impacts due to its geographical location and diverse climate zones. Türkiye prepared its first National Climate Change Adaptation Strategy and Action Plan (NASAP) in 2011 and developed an updated plan for the 2024-2030 period. Under UNDP's "Strengthening Adaptation Action in Türkiye Project": better decision-making tools for national climate change adaptation policies, urban adaptation planning solutions, and a Climate Change Adaptation Grant Program (CCAGP) are being established.
What are Türkiye's most vulnerable regions to climate change?
Türkiye's most vulnerable regions to climate change: Mediterranean and Aegean coasts (sea level rise, coastal erosion), Southeastern Anatolia (drought and water scarcity risk), Central Anatolia (heat waves and agricultural stress), Black Sea region (extreme rainfall and flood risk). Large urban areas like Istanbul are vulnerable due to urban heat island effects and increasing pressure on infrastructure. Small agricultural communities and coastal fishing communities show economic vulnerability.
What are Türkiye's NASAP priorities?
NASAP (National Climate Change Adaptation Strategy and Action Plan) priority sectors: Water resources management (drought, flood management), Agriculture and food security (drought-resistant varieties, irrigation efficiency), Ecosystem and biodiversity (forest fires, wetland protection), Health (heat wave early warning, vector-borne diseases), Energy (hydroelectric impacts, cooling demand), Transport and infrastructure (resilience to extreme weather). NASAP emphasizes inter-institutional coordination and local government participation.
What is Türkiye's Climate Change Adaptation Grant Program (CCAGP)?
CCAGP (Climate Change Adaptation Grant Program) was established in cooperation with UNDP and Türkiye to finance local-level adaptation actions. The program provides grants to local governments, NGOs, and the private sector to implement adaptation projects. Priority areas: water conservation, urban green infrastructure, sustainable agriculture, ecosystem restoration, disaster risk reduction. CCAGP helps test pilot projects and scale best practices. Capacity building and community participation are core components of the program.
What is the relationship between Türkiye's Paris Agreement commitments and adaptation?
Türkiye ratified the Paris Agreement in 2021 and set a 2053 net zero target. The NDC (Nationally Determined Contribution) includes both mitigation and adaptation components. Adaptation component: water resources management, climate-smart practices in agriculture, early warning systems, ecosystem resilience. Türkiye is seeking adaptation financing from the Adaptation Fund and Green Climate Fund. The Climate Law (2024 draft) aims to anchor adaptation planning in a legal framework. Türkiye addresses both mitigation and adaptation within an integrated "climate resilience" framework.
Biogas Production Process
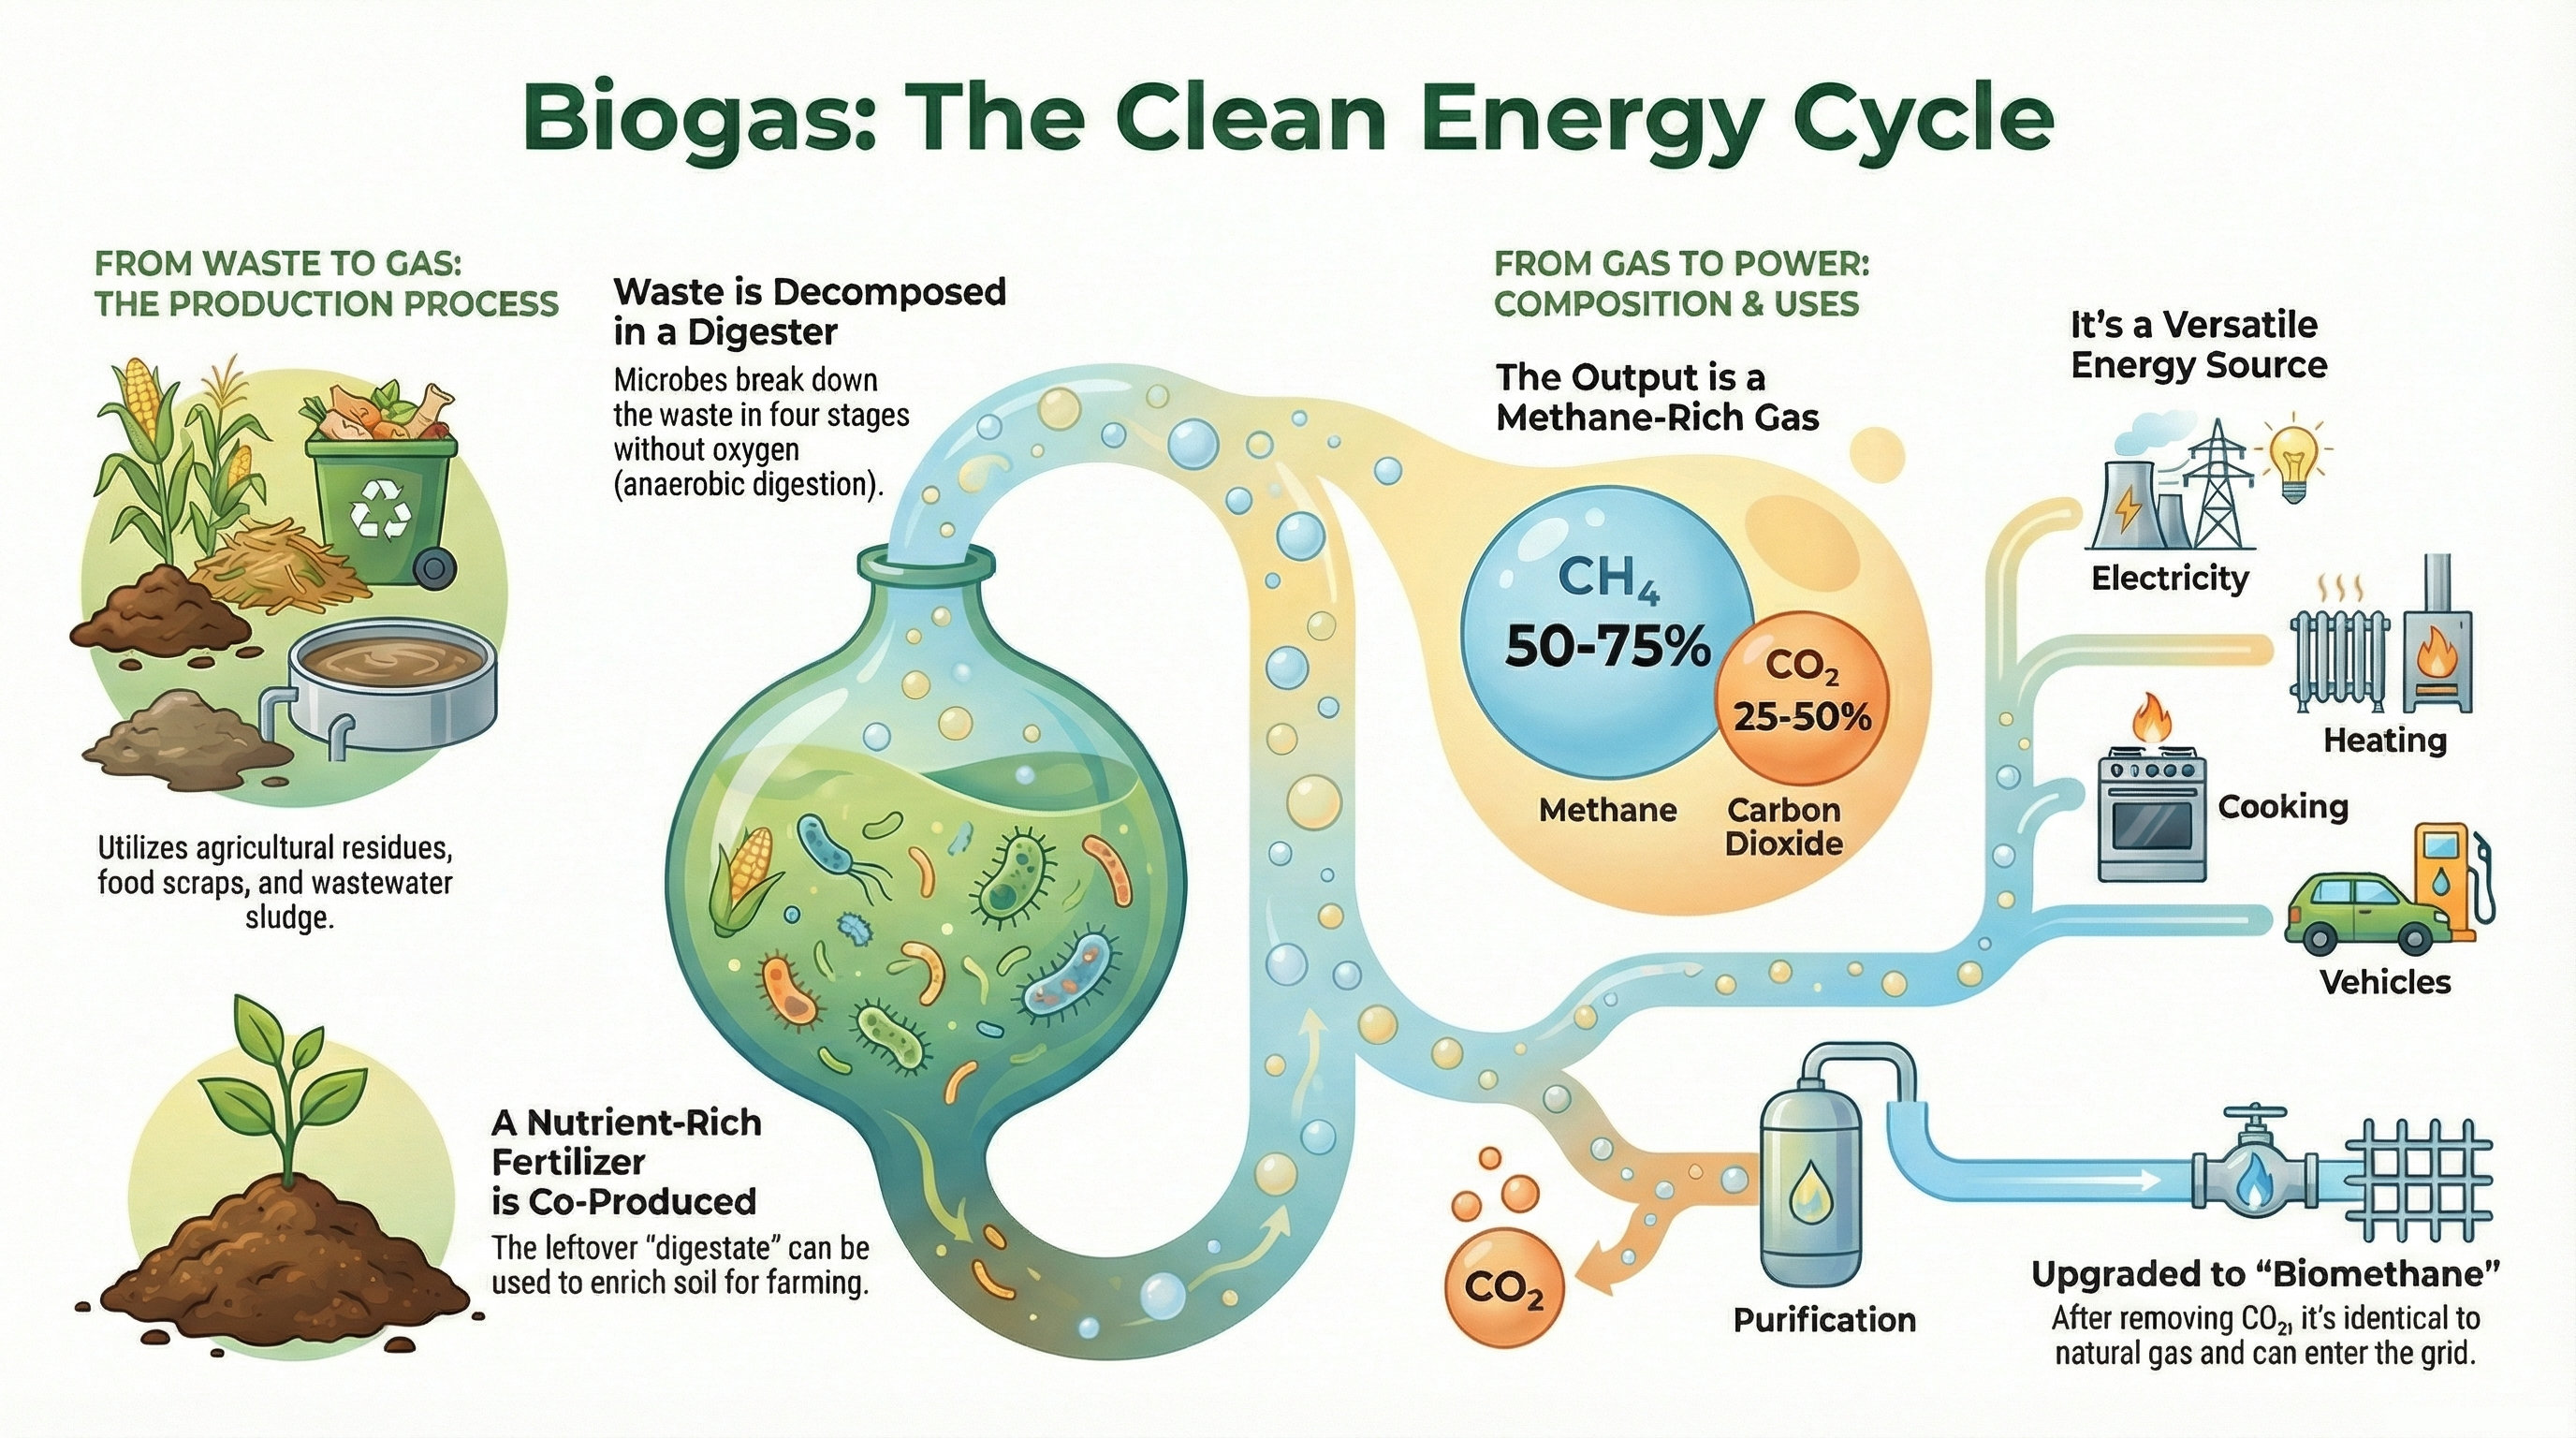
Detailed infographic explaining the process of converting organic waste into energy through anaerobic digestion.
The Greenhouse Effect Mechanism
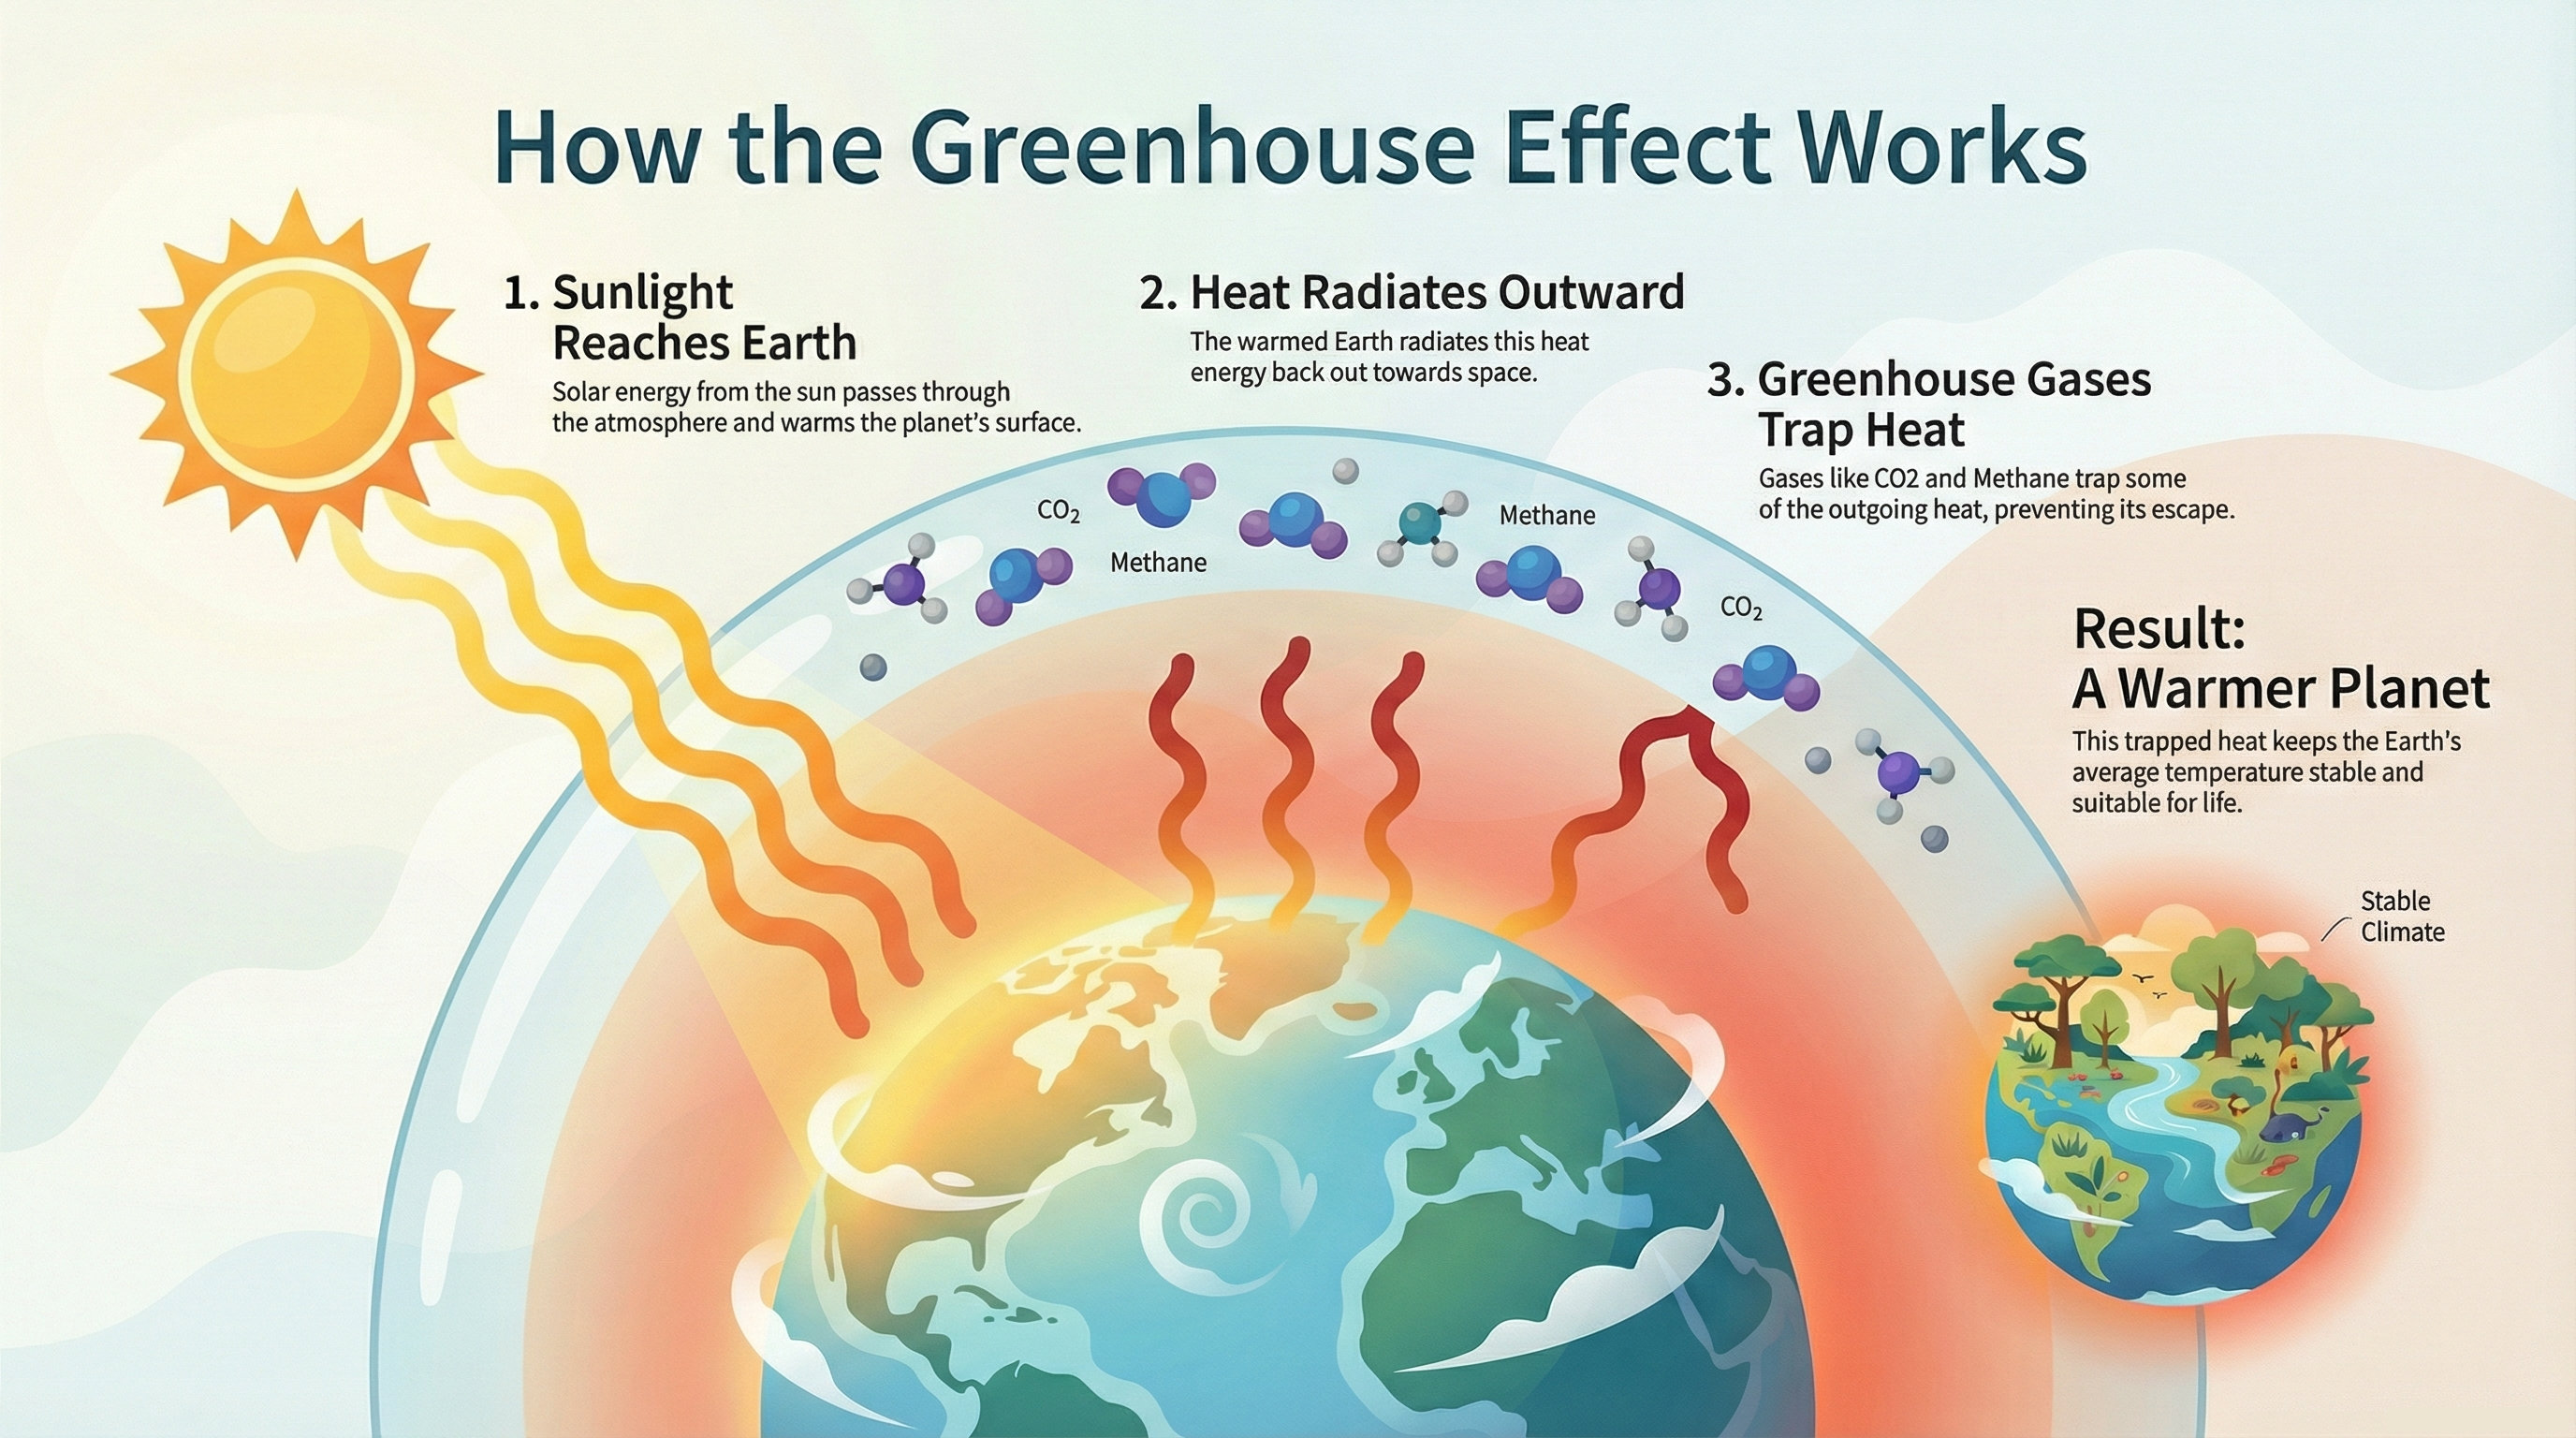
Visual explanation of how greenhouse gases in Earth's atmosphere trap heat and lead to global warming.
Climate Thresholds and Tipping Points
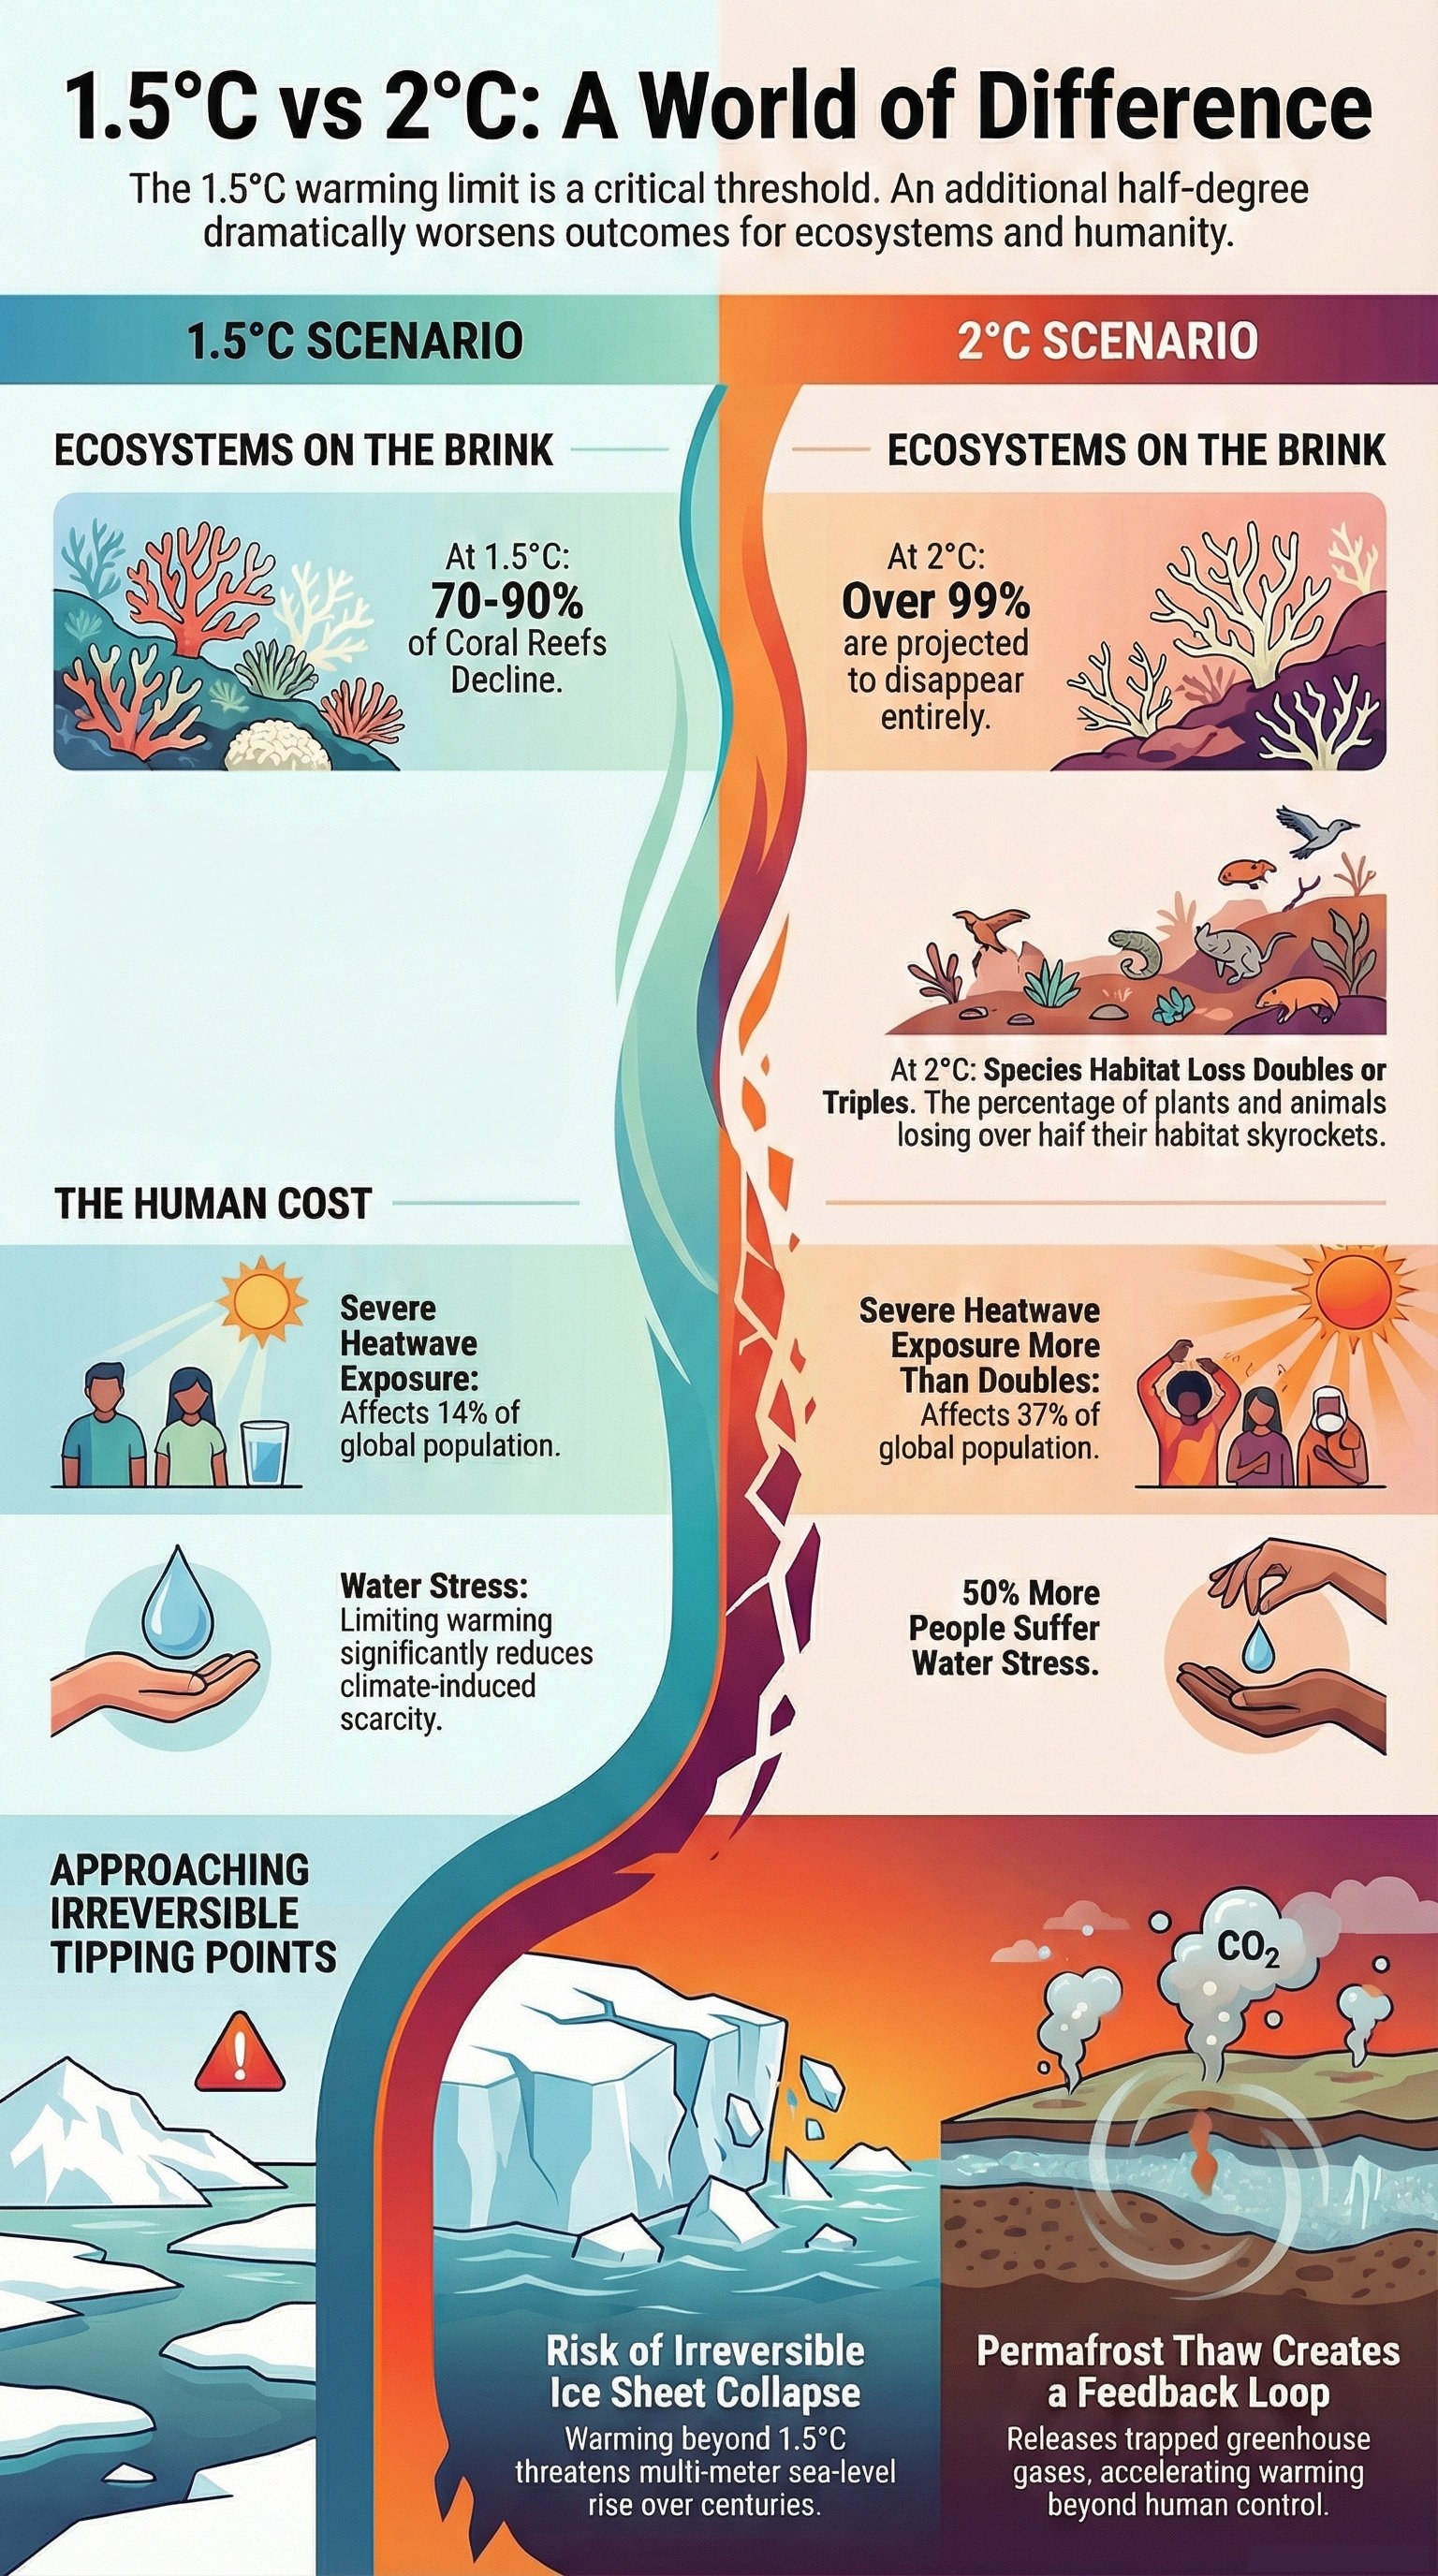
Infographic showing critical threshold values in the climate system and irreversible changes that may occur if these limits are exceeded.
Clean Energy Storage Technologies
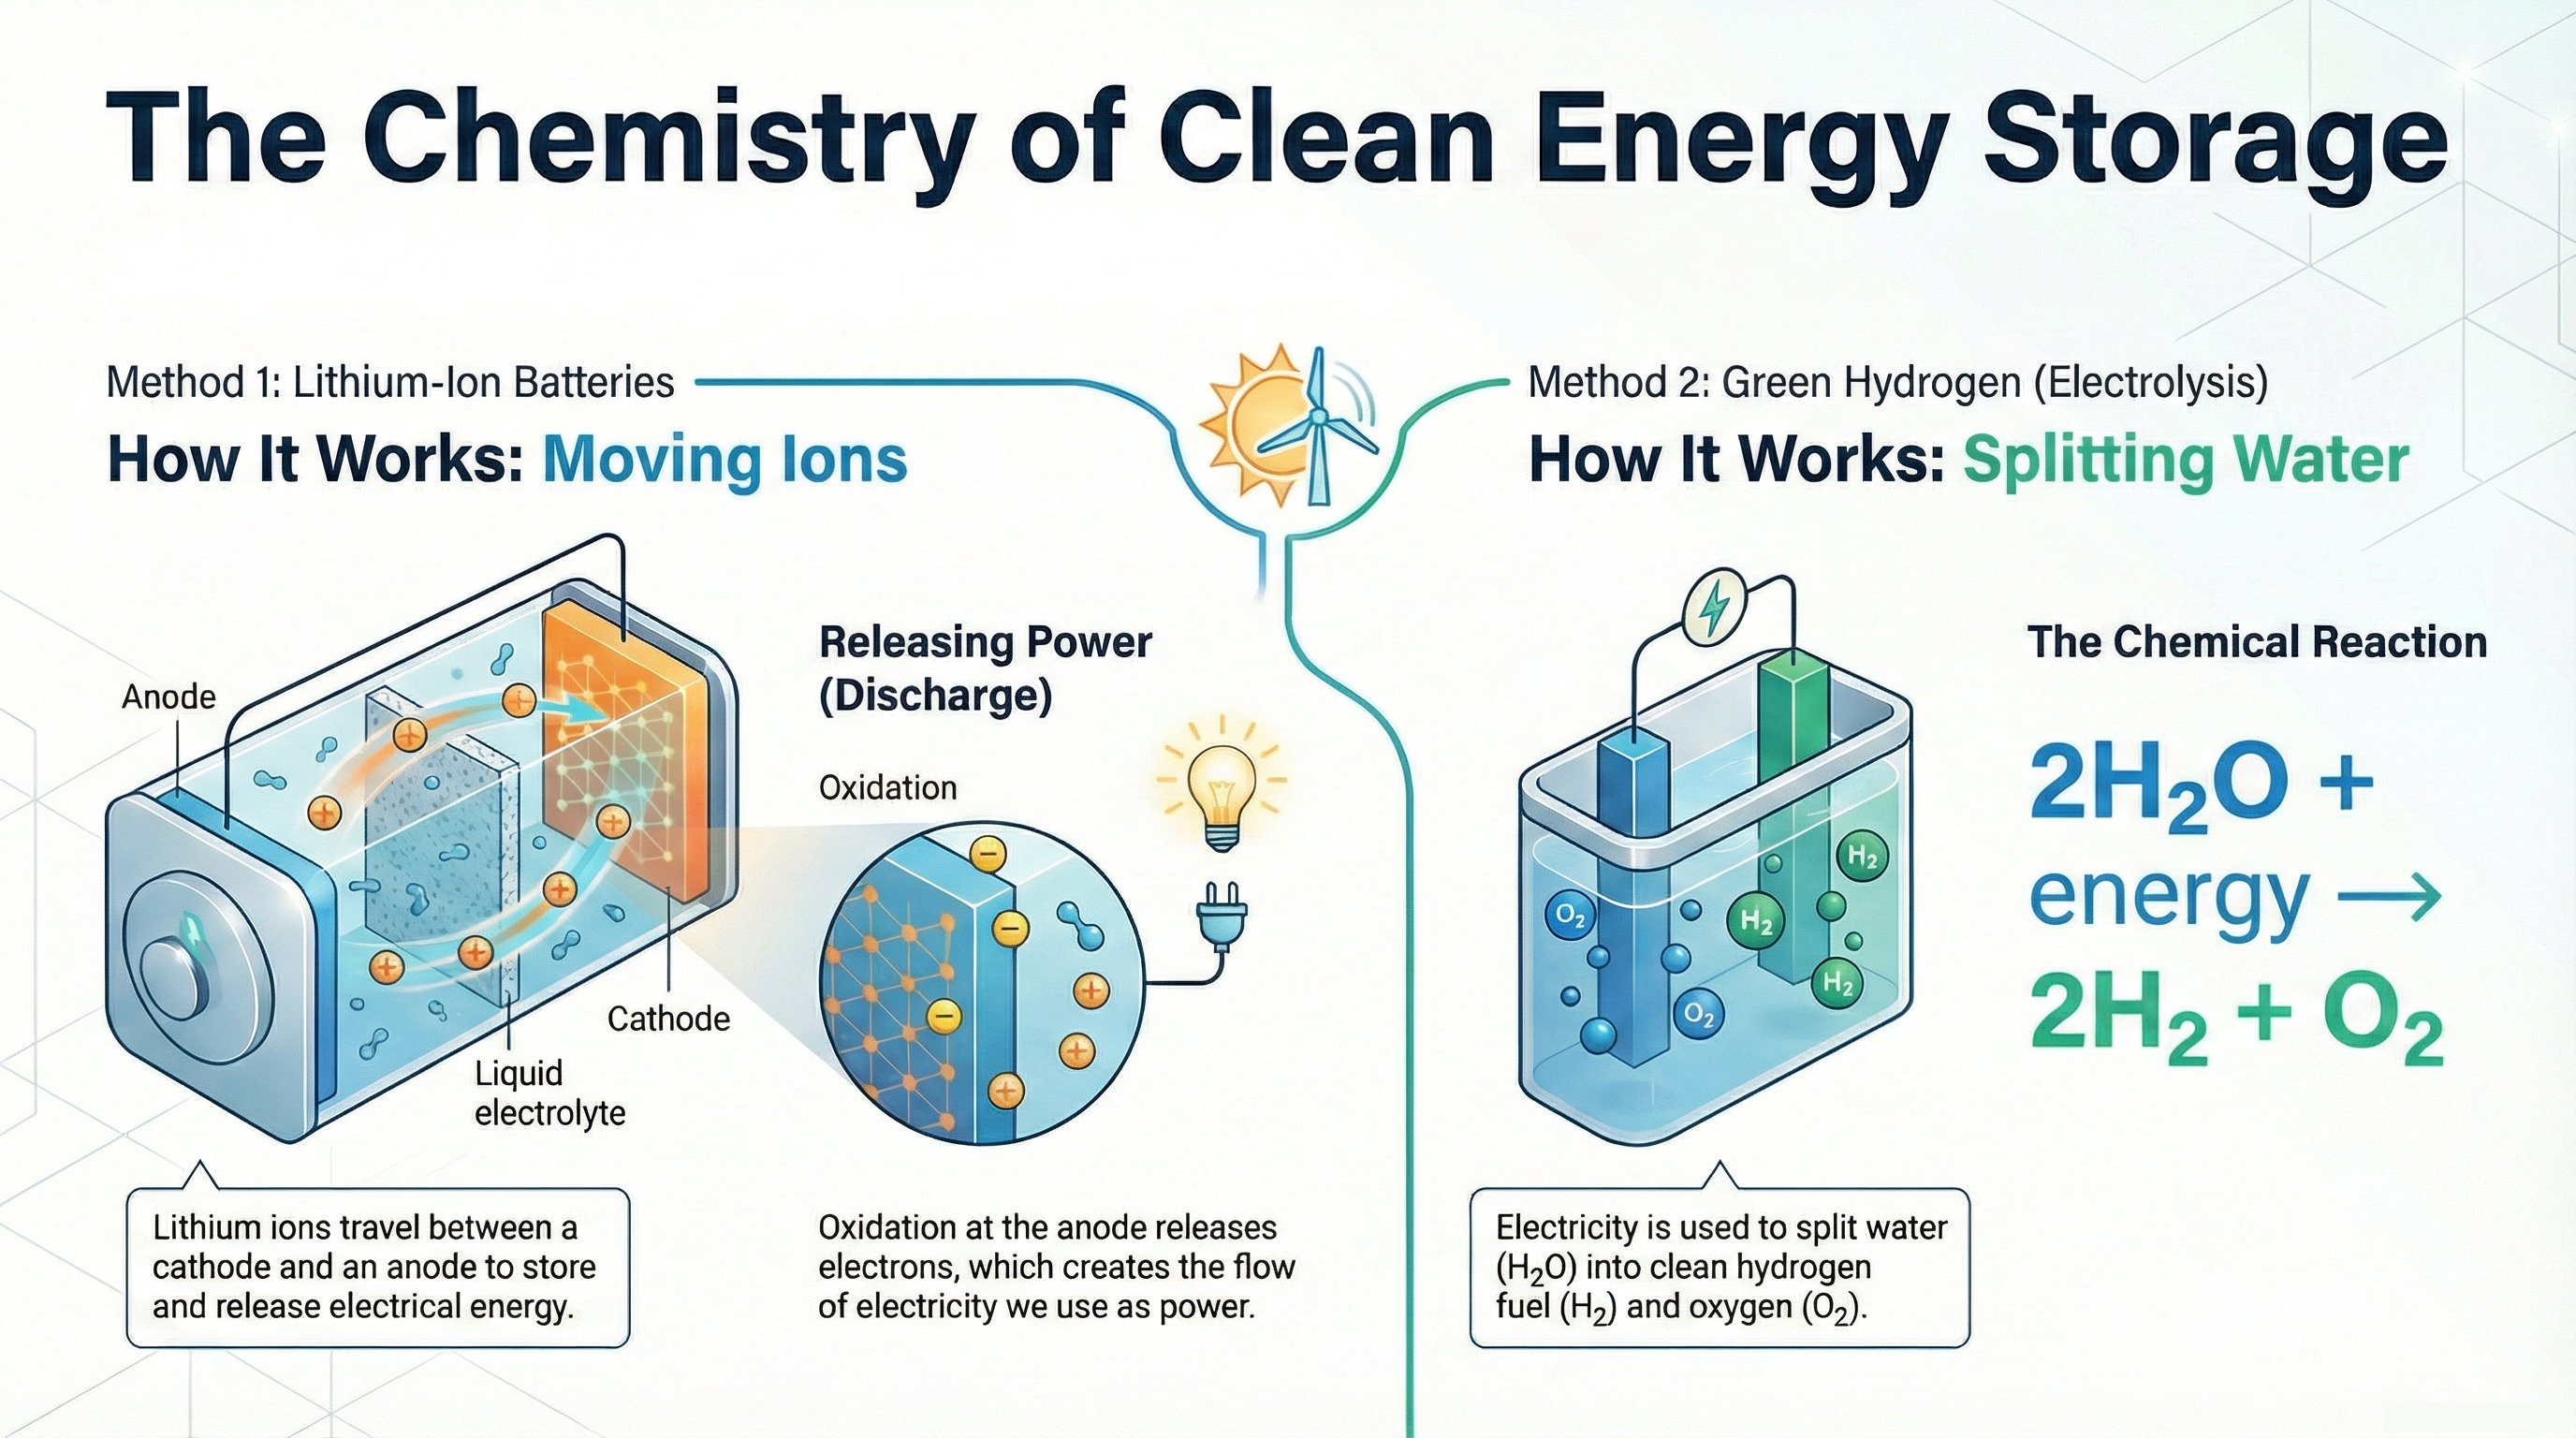
Technologies used for storing energy from renewable sources and ensuring grid flexibility.
Albedo Effect and Climate
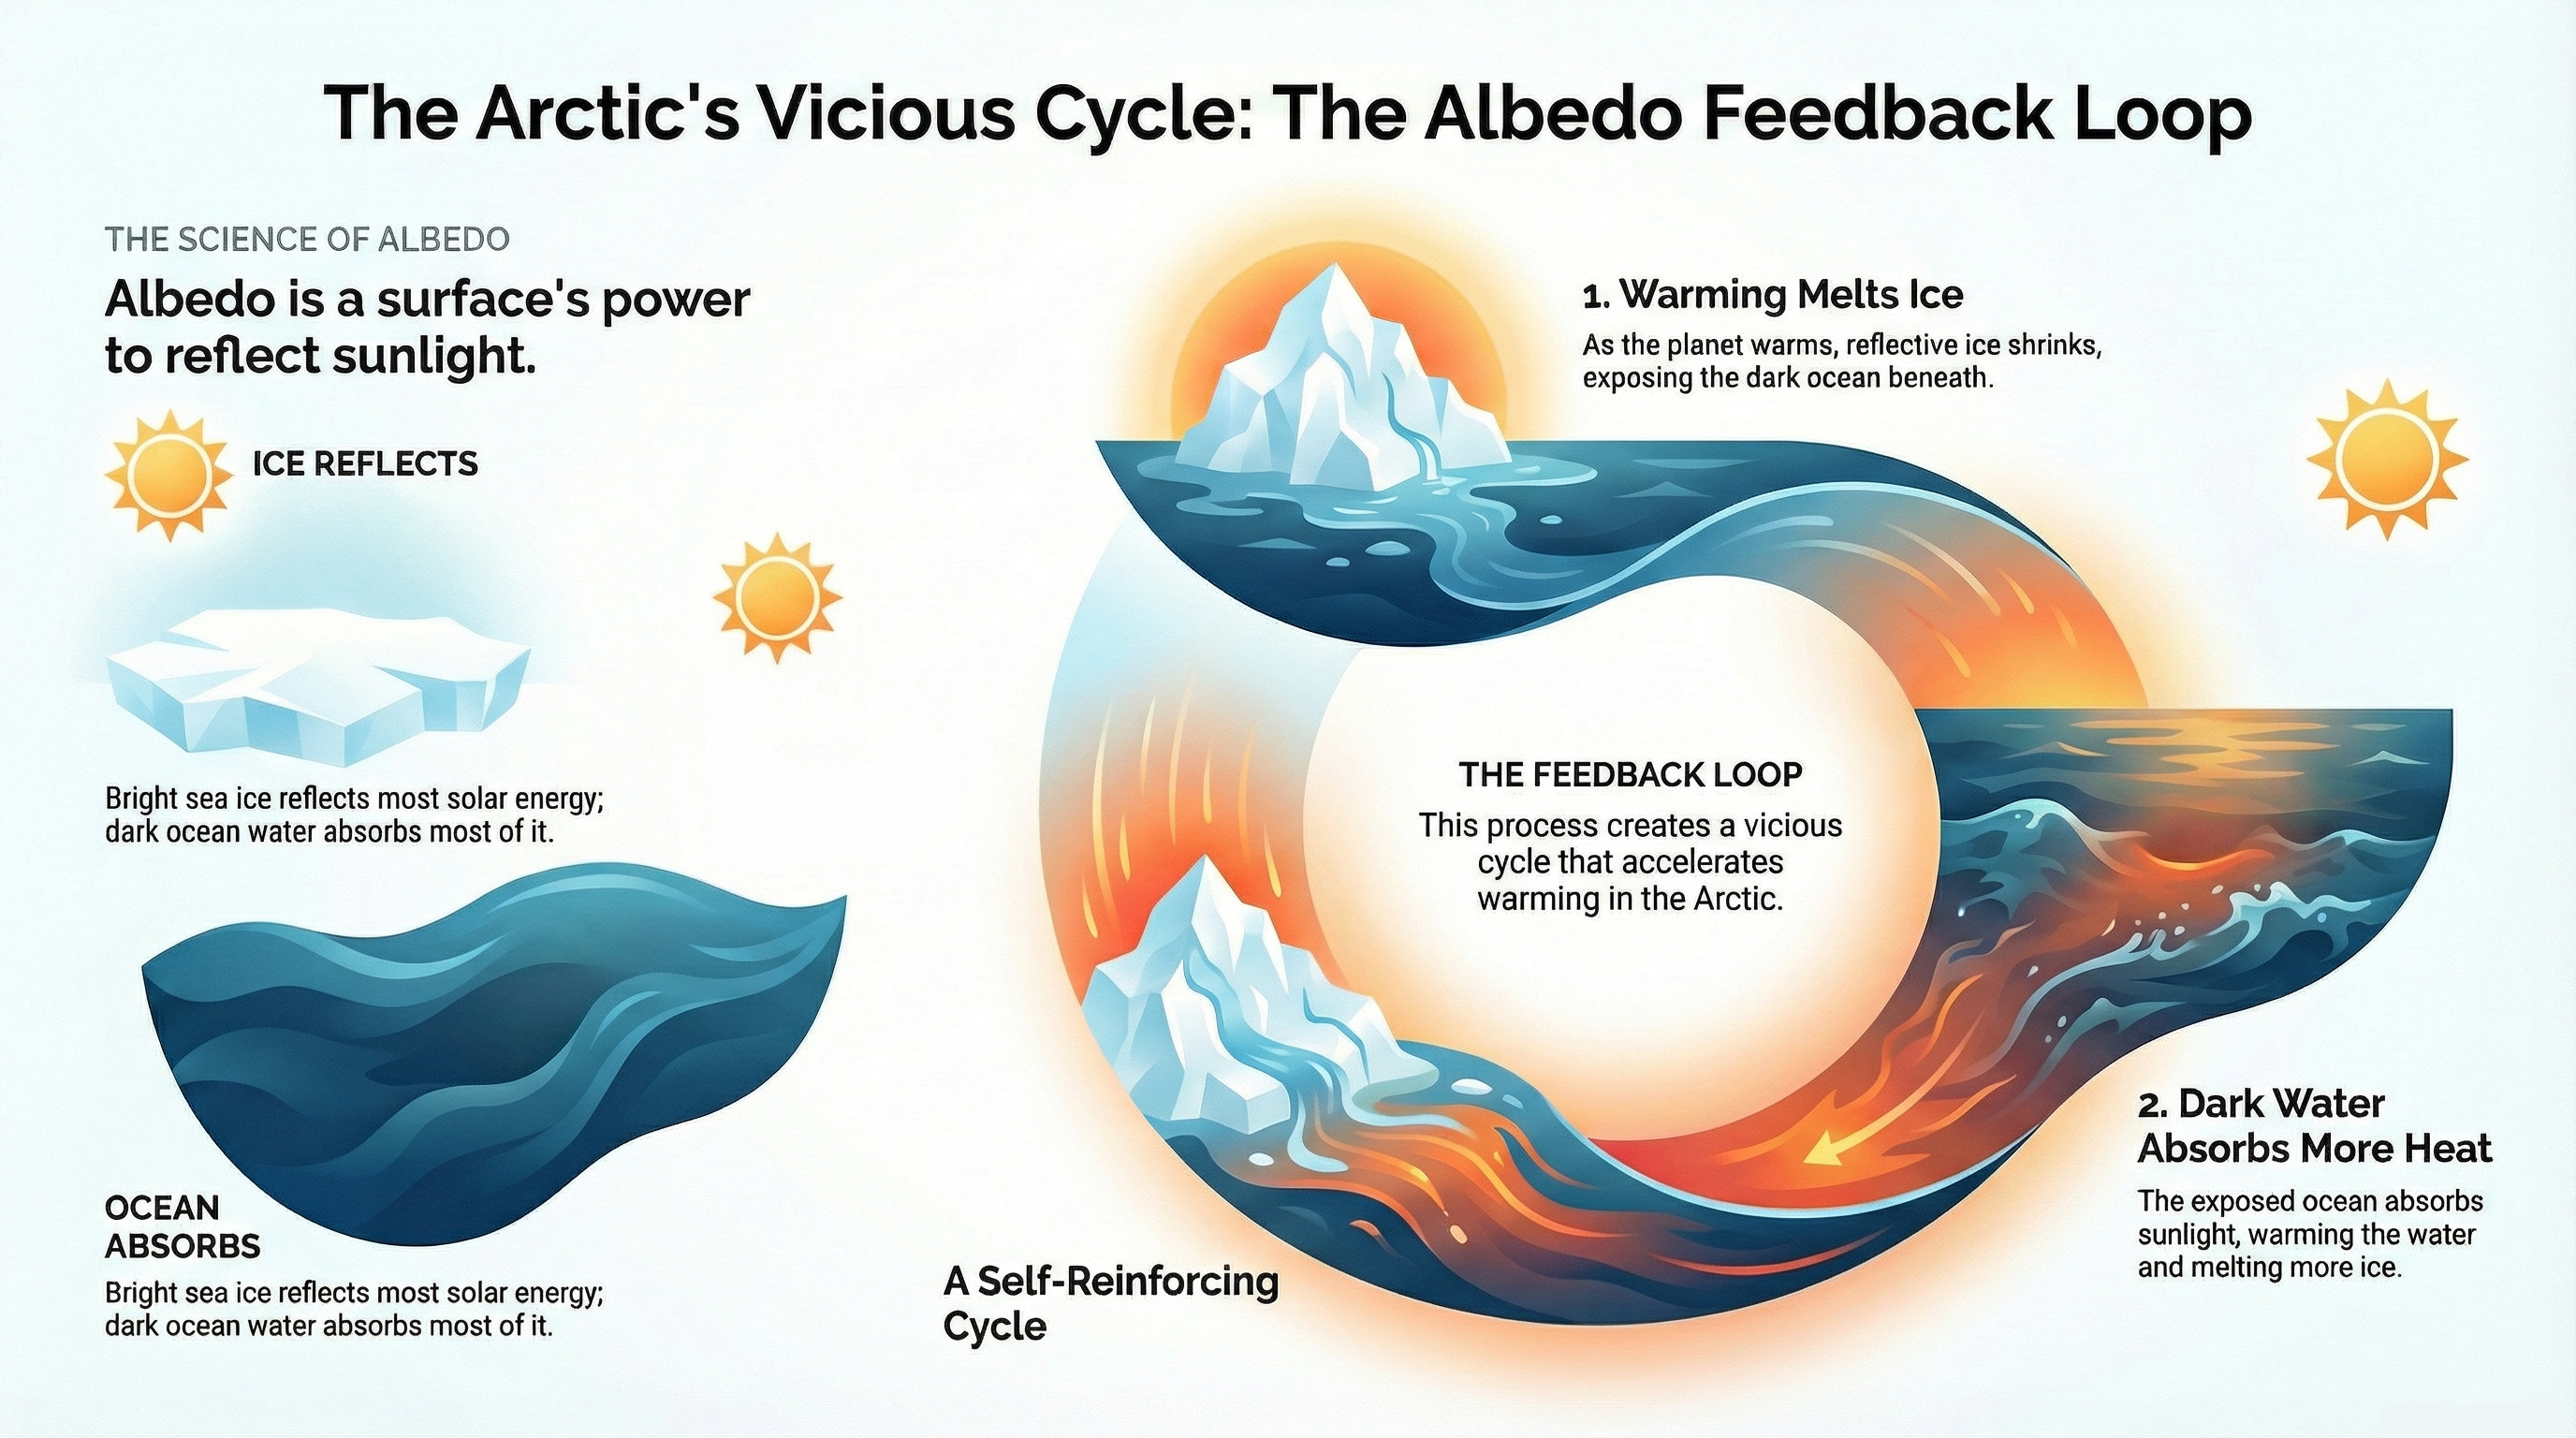
The capacity of surfaces to reflect sunlight (albedo) and how the reduction of this effect due to melting ice accelerates warming.
Nitrogen Leakage and Environmental Impacts
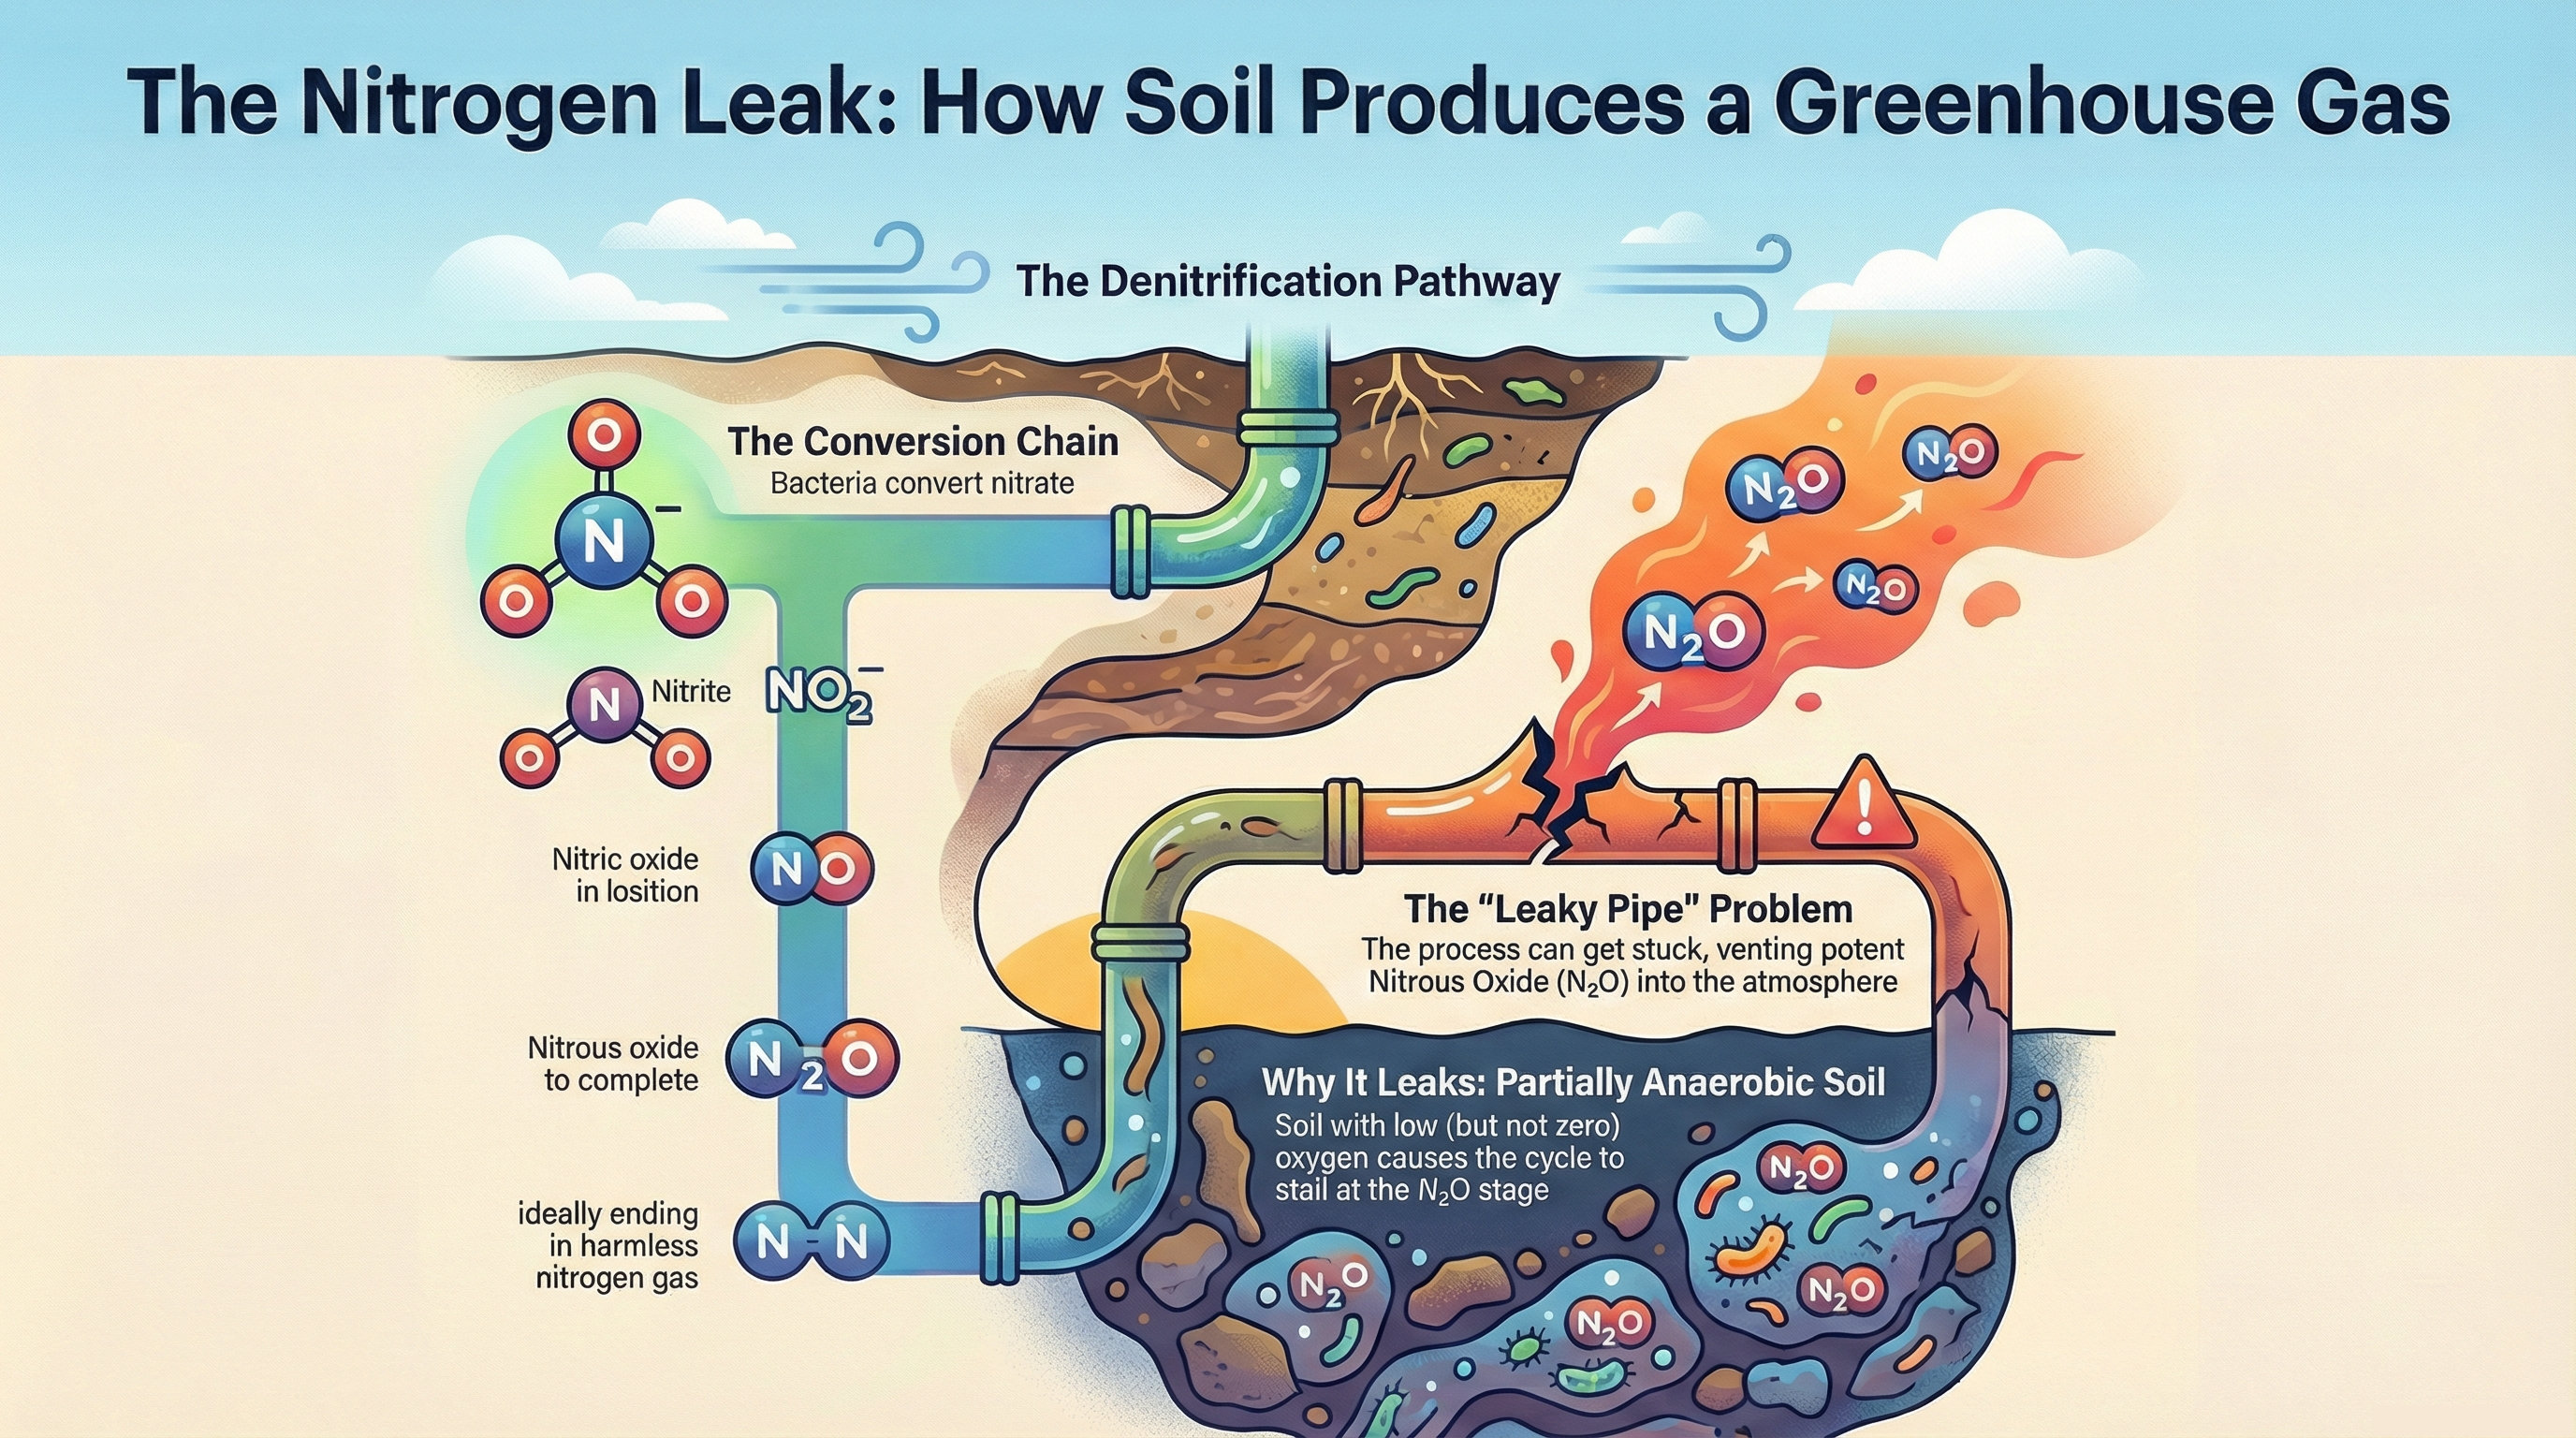
Infographic showing the impacts of nitrogen leakage from agricultural and industrial activities on ecosystems and mitigation methods.
Ocean Acidification and Impacts
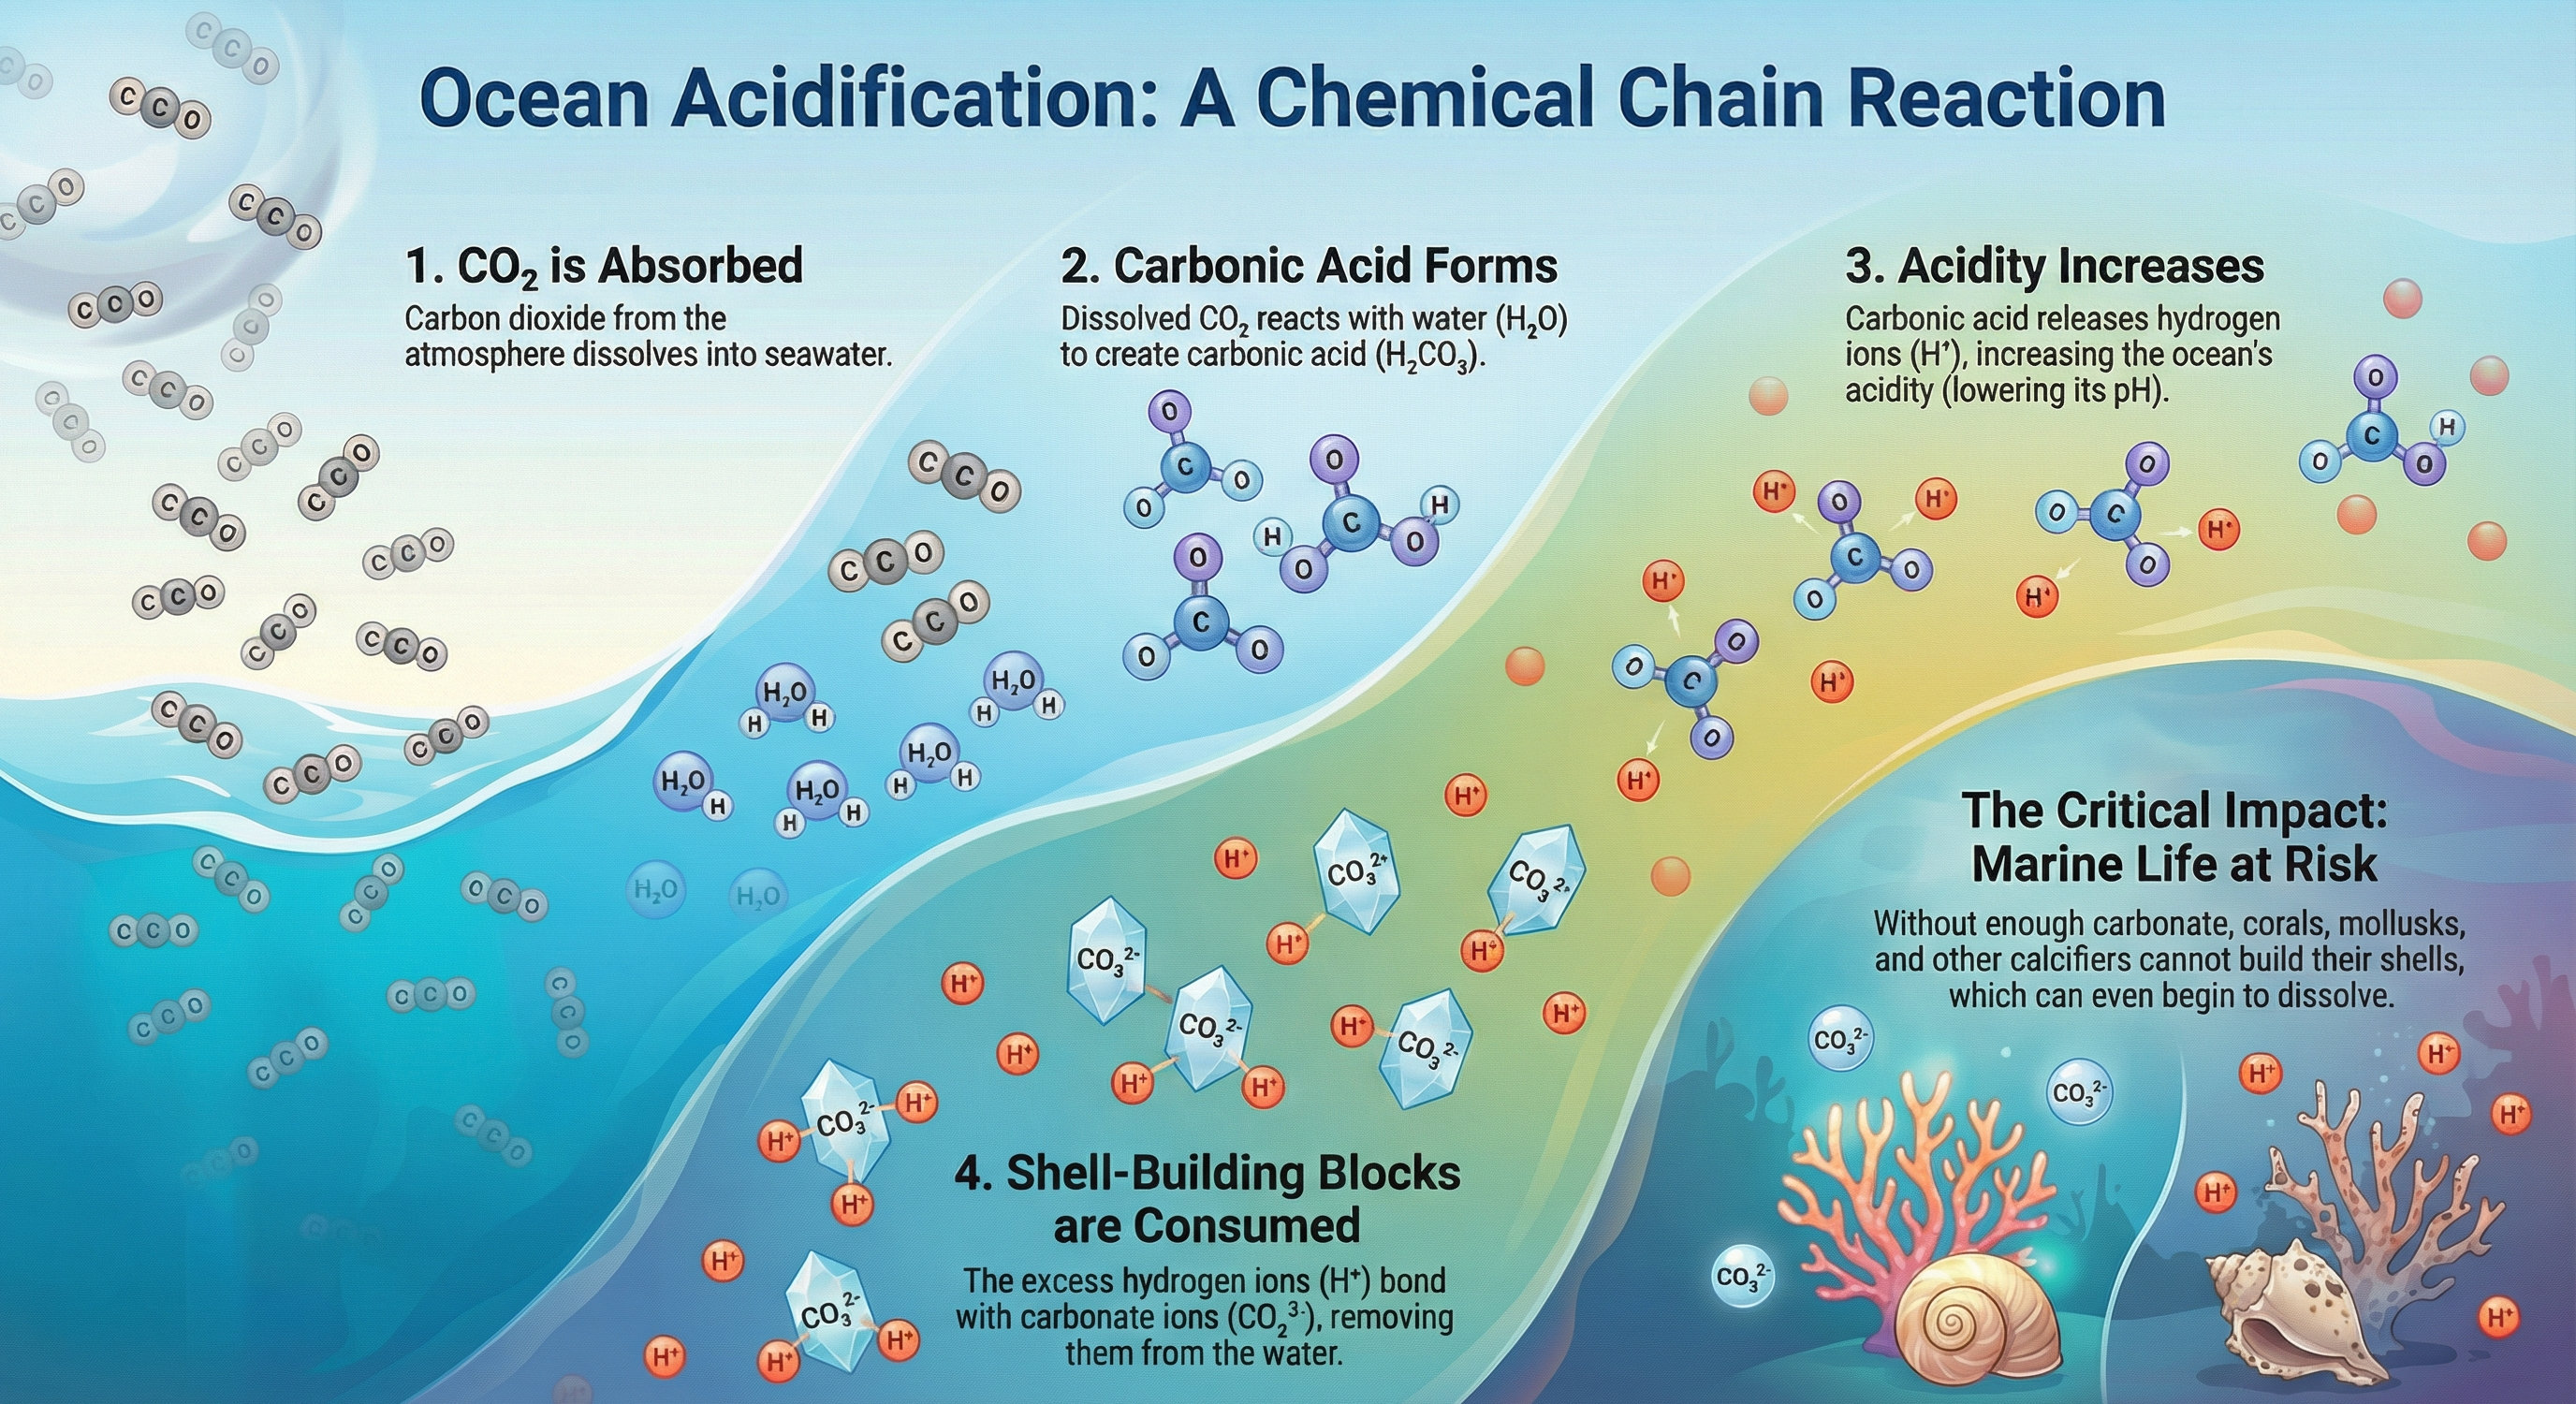
Visual explanation of how increased CO₂ absorption acidifies oceans and the devastating effects on marine ecosystems.
Lithium-Ion Battery Technology
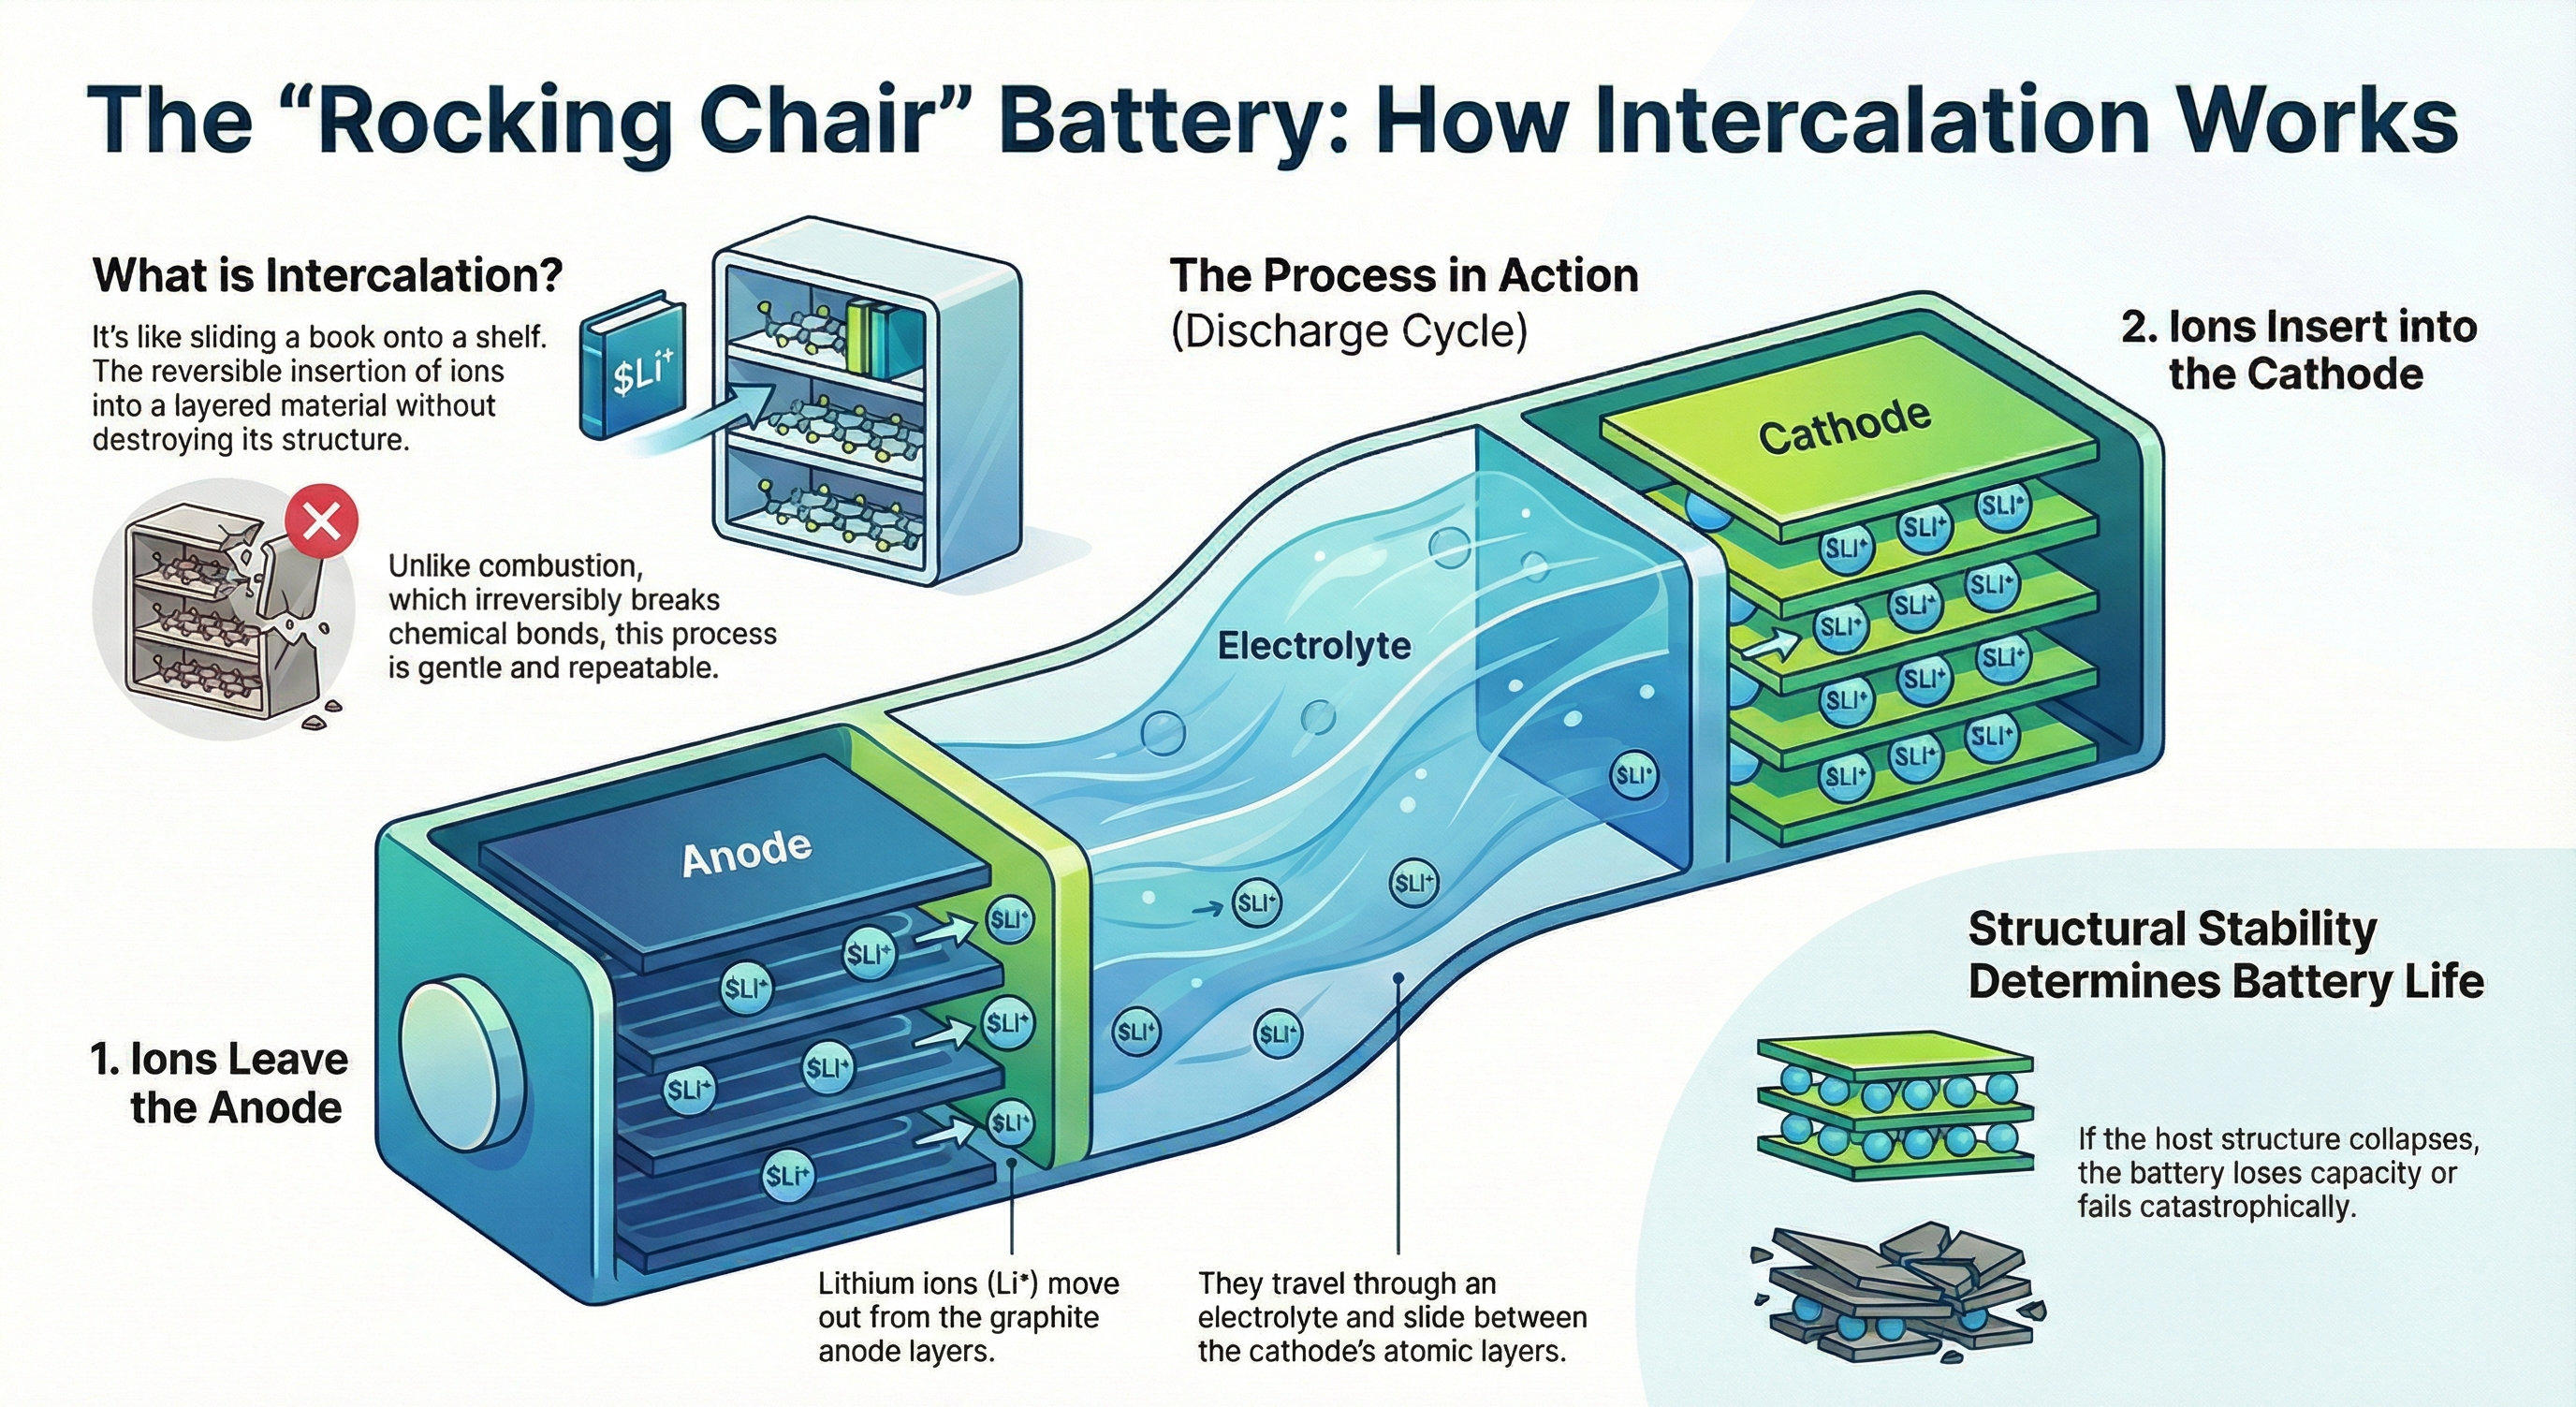
Infographic explaining the working principle and advantages of lithium-ion batteries used in electric vehicles and energy storage systems.
Ocean Carbon Sequestration
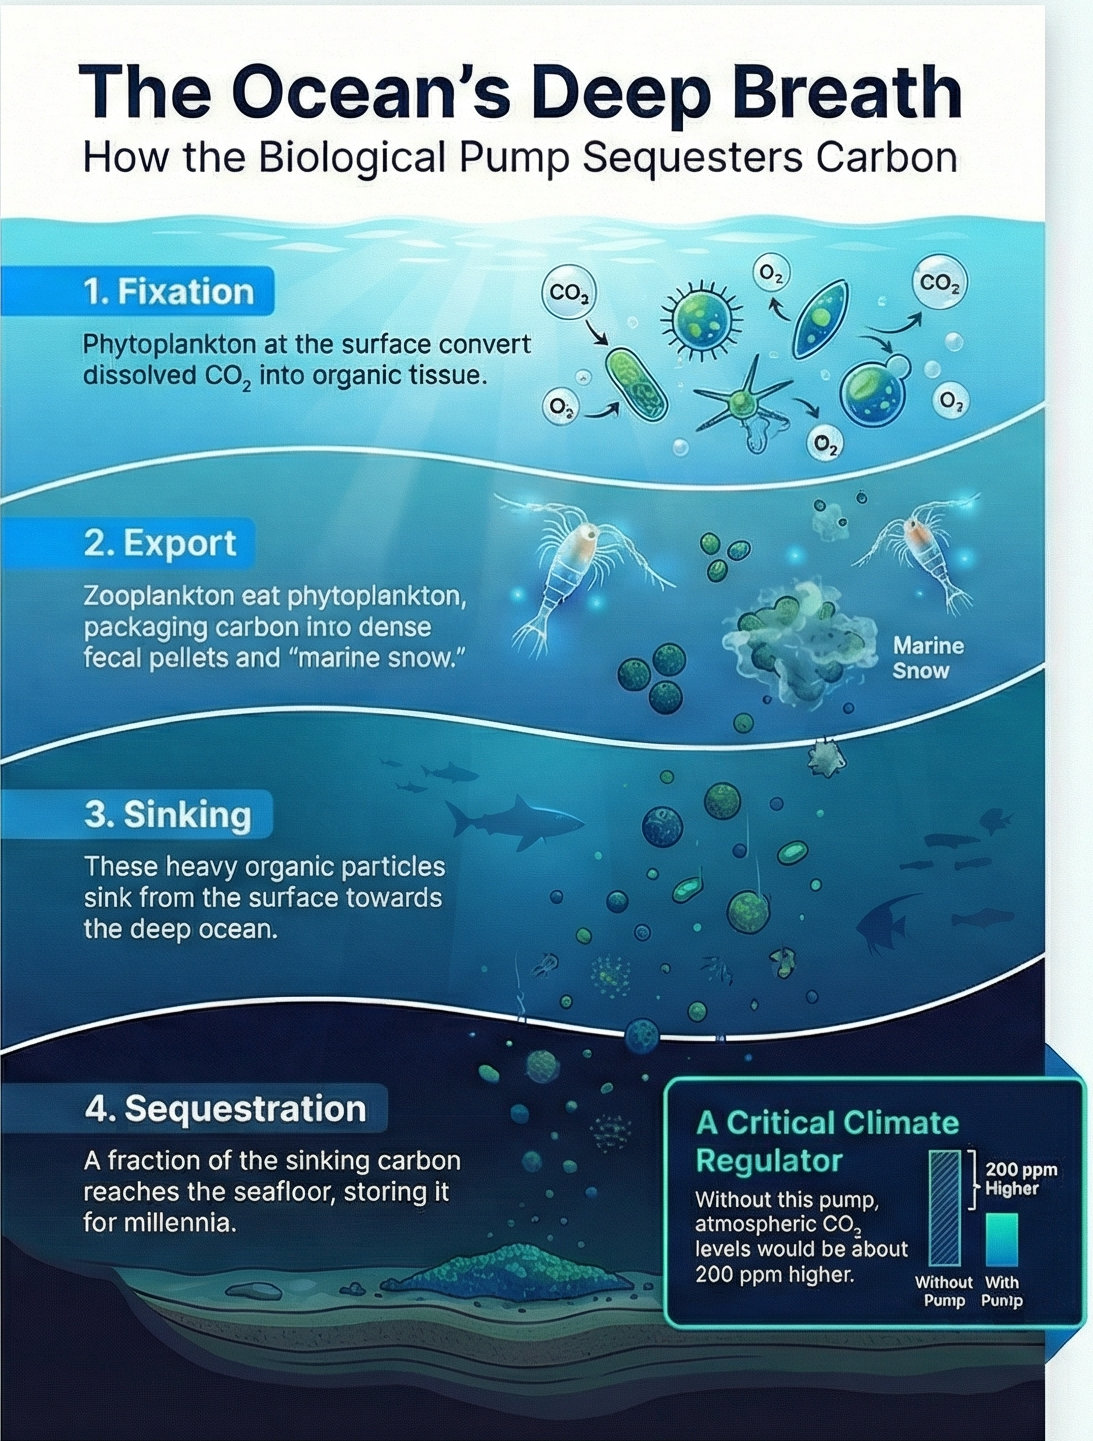
Infographic showing how oceans absorb and store carbon dioxide from the atmosphere (biological and solubility pumps).
Working Principle of Photovoltaic Systems
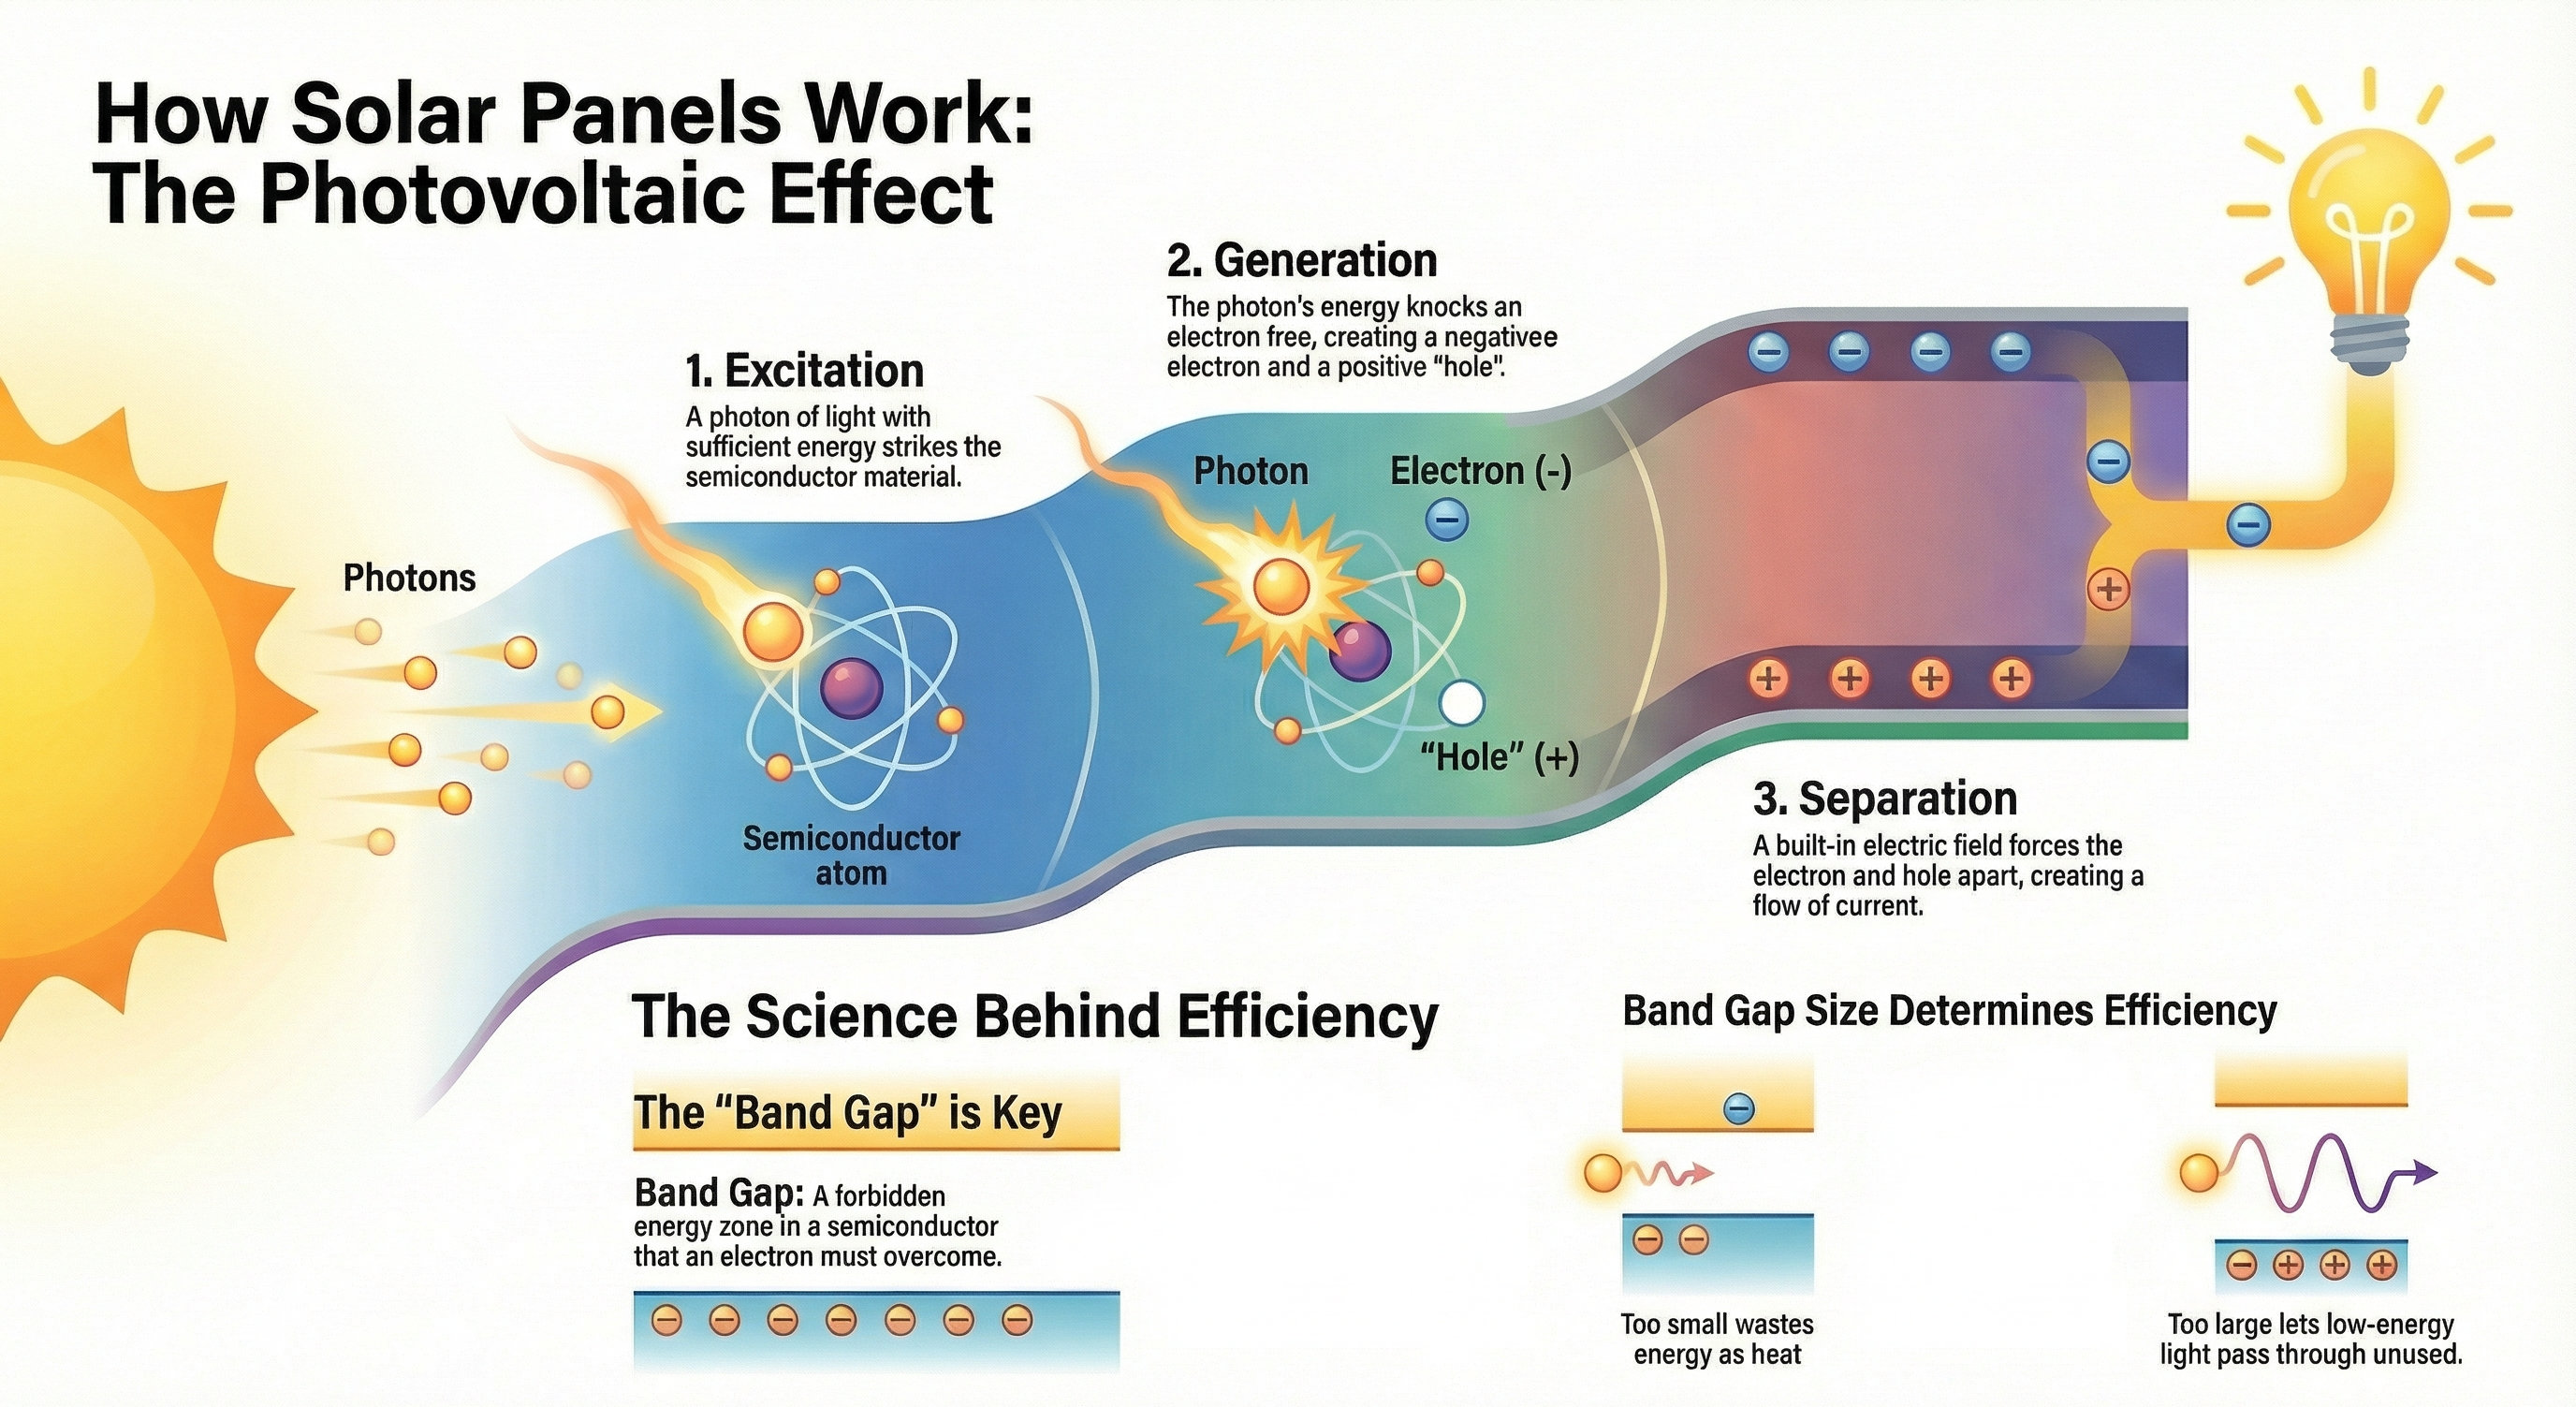
Infographic explaining the process of converting sunlight directly into electrical energy (photovoltaic effect) by solar panels.
Calcination Process
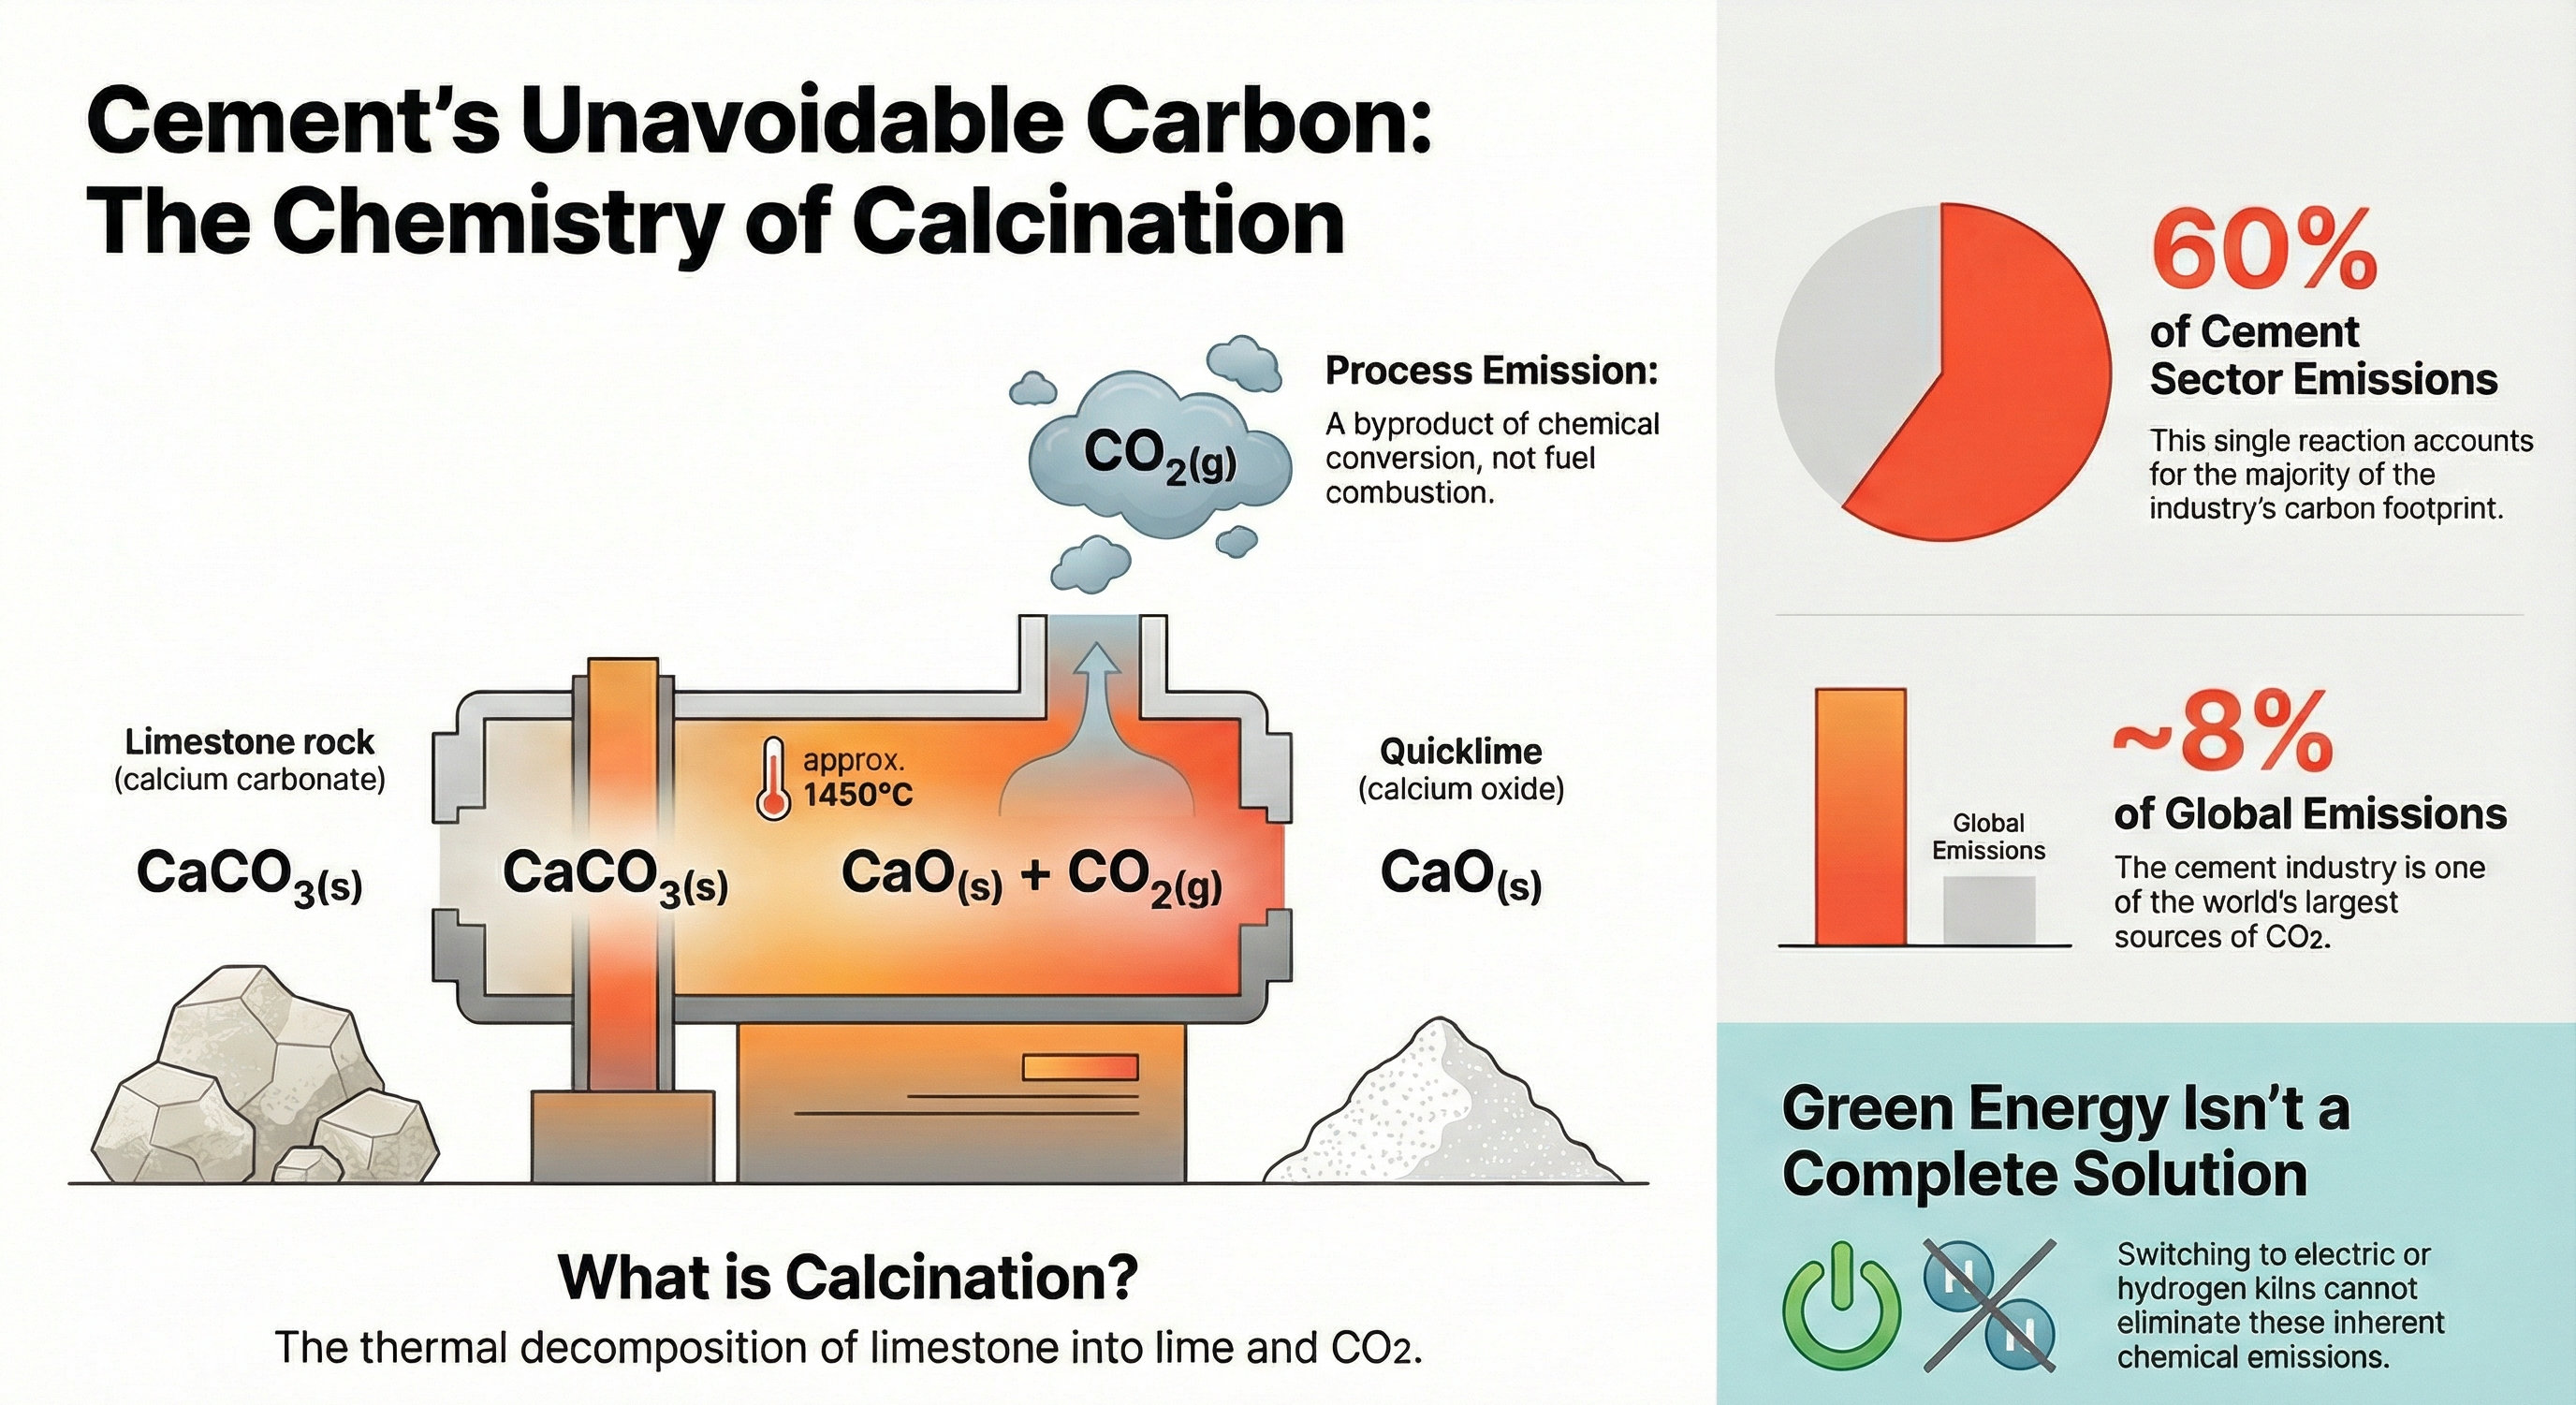
Infographic explaining the process of heating limestone to produce quicklime in cement production, releasing CO₂ in the process.
What is Radiative Forcing?
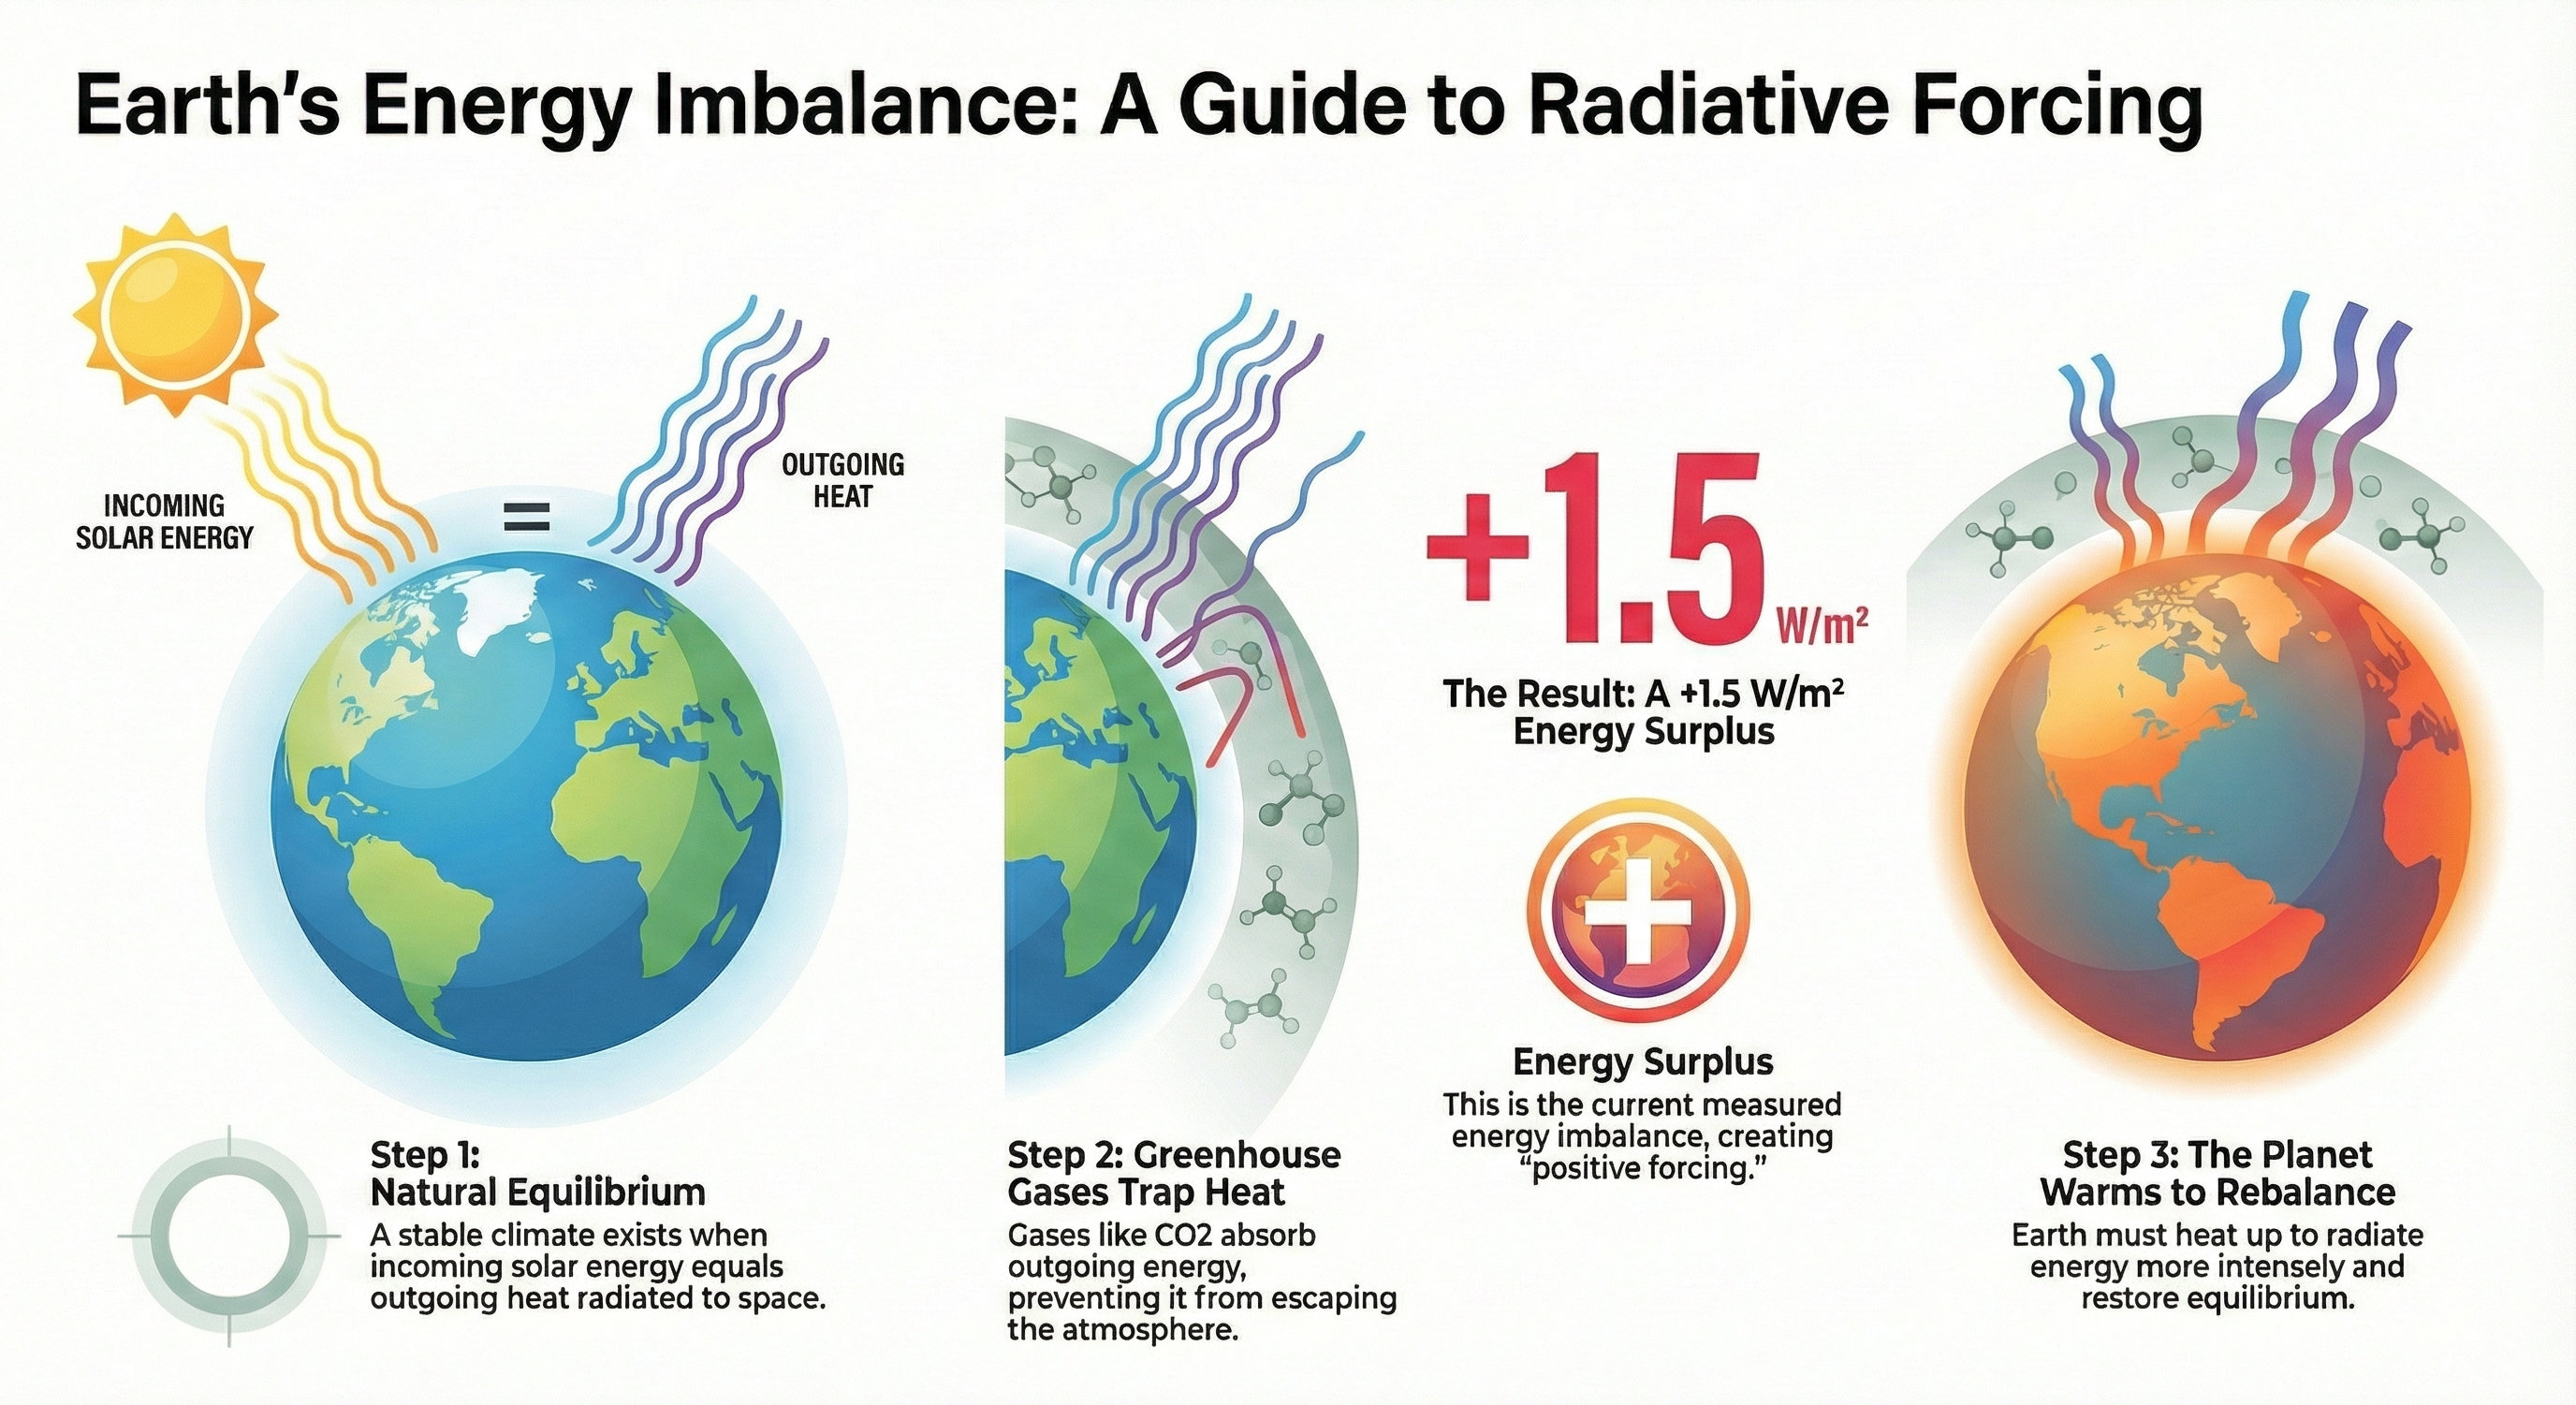
Infographic showing the difference between solar energy entering the atmosphere and energy reflected back to space, and its impact on global warming.
Coal Burning and Its Impacts
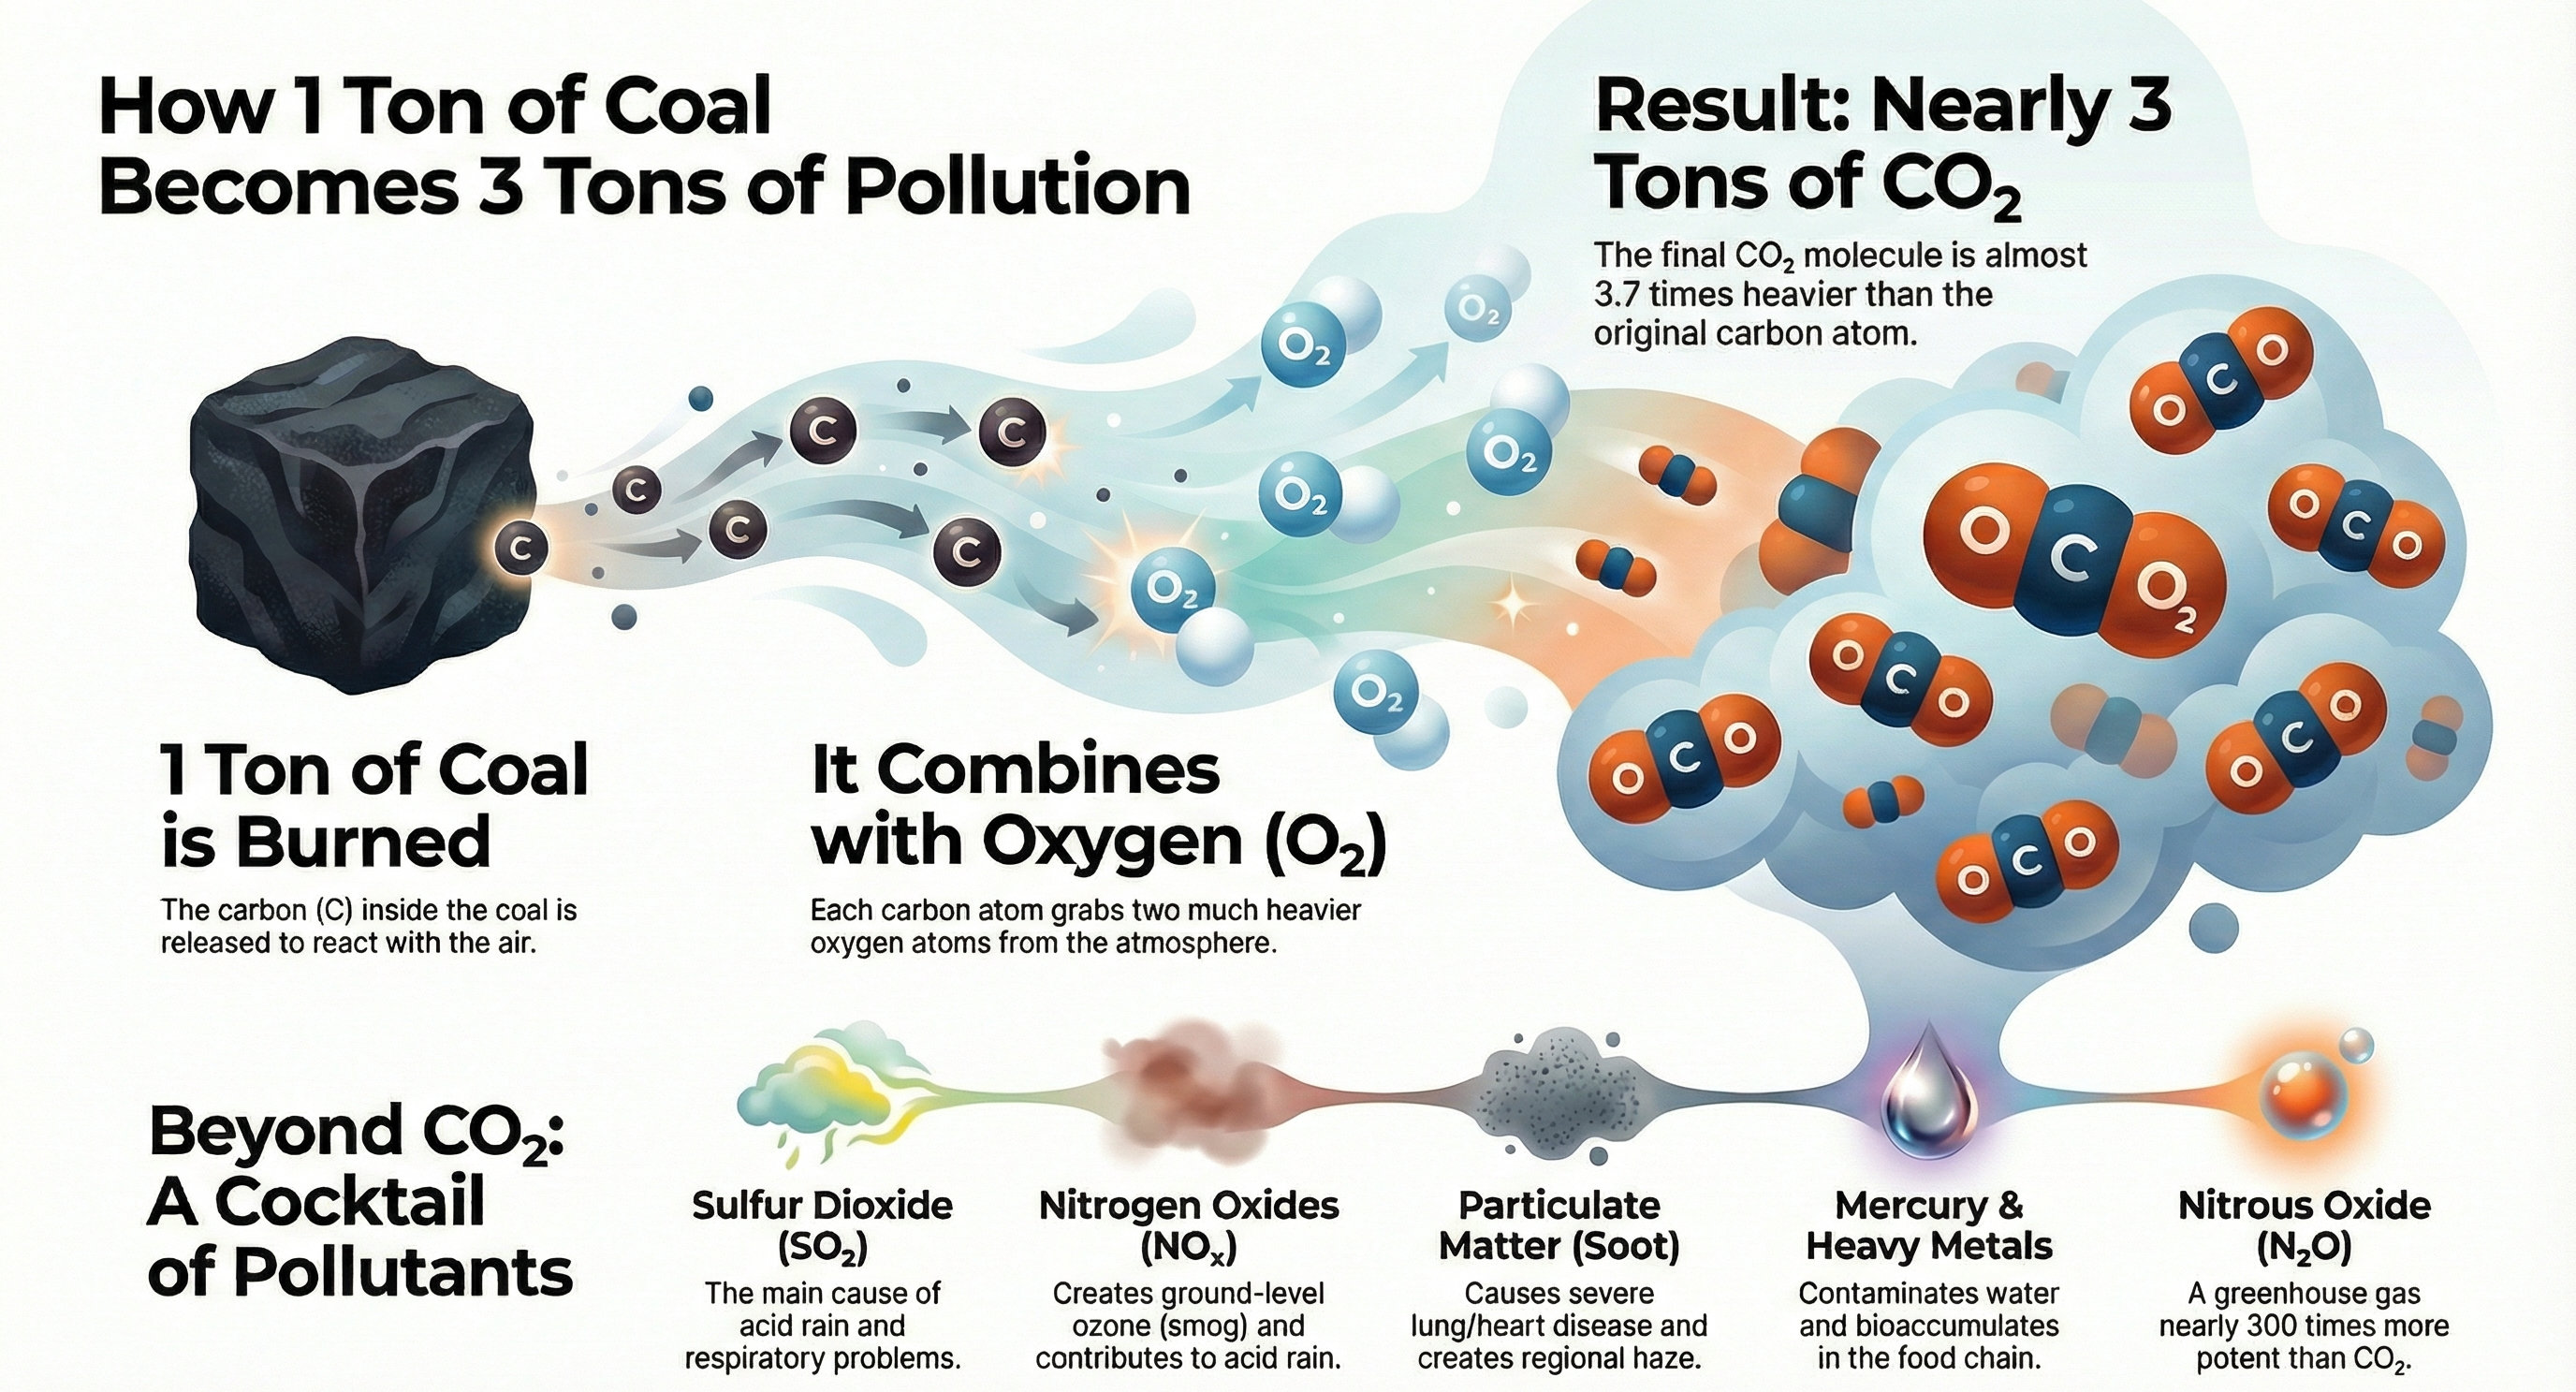
Infographic showing emissions released from burning coal and the contribution of this process to air pollution and climate change.
Working Principle of Wind Turbines
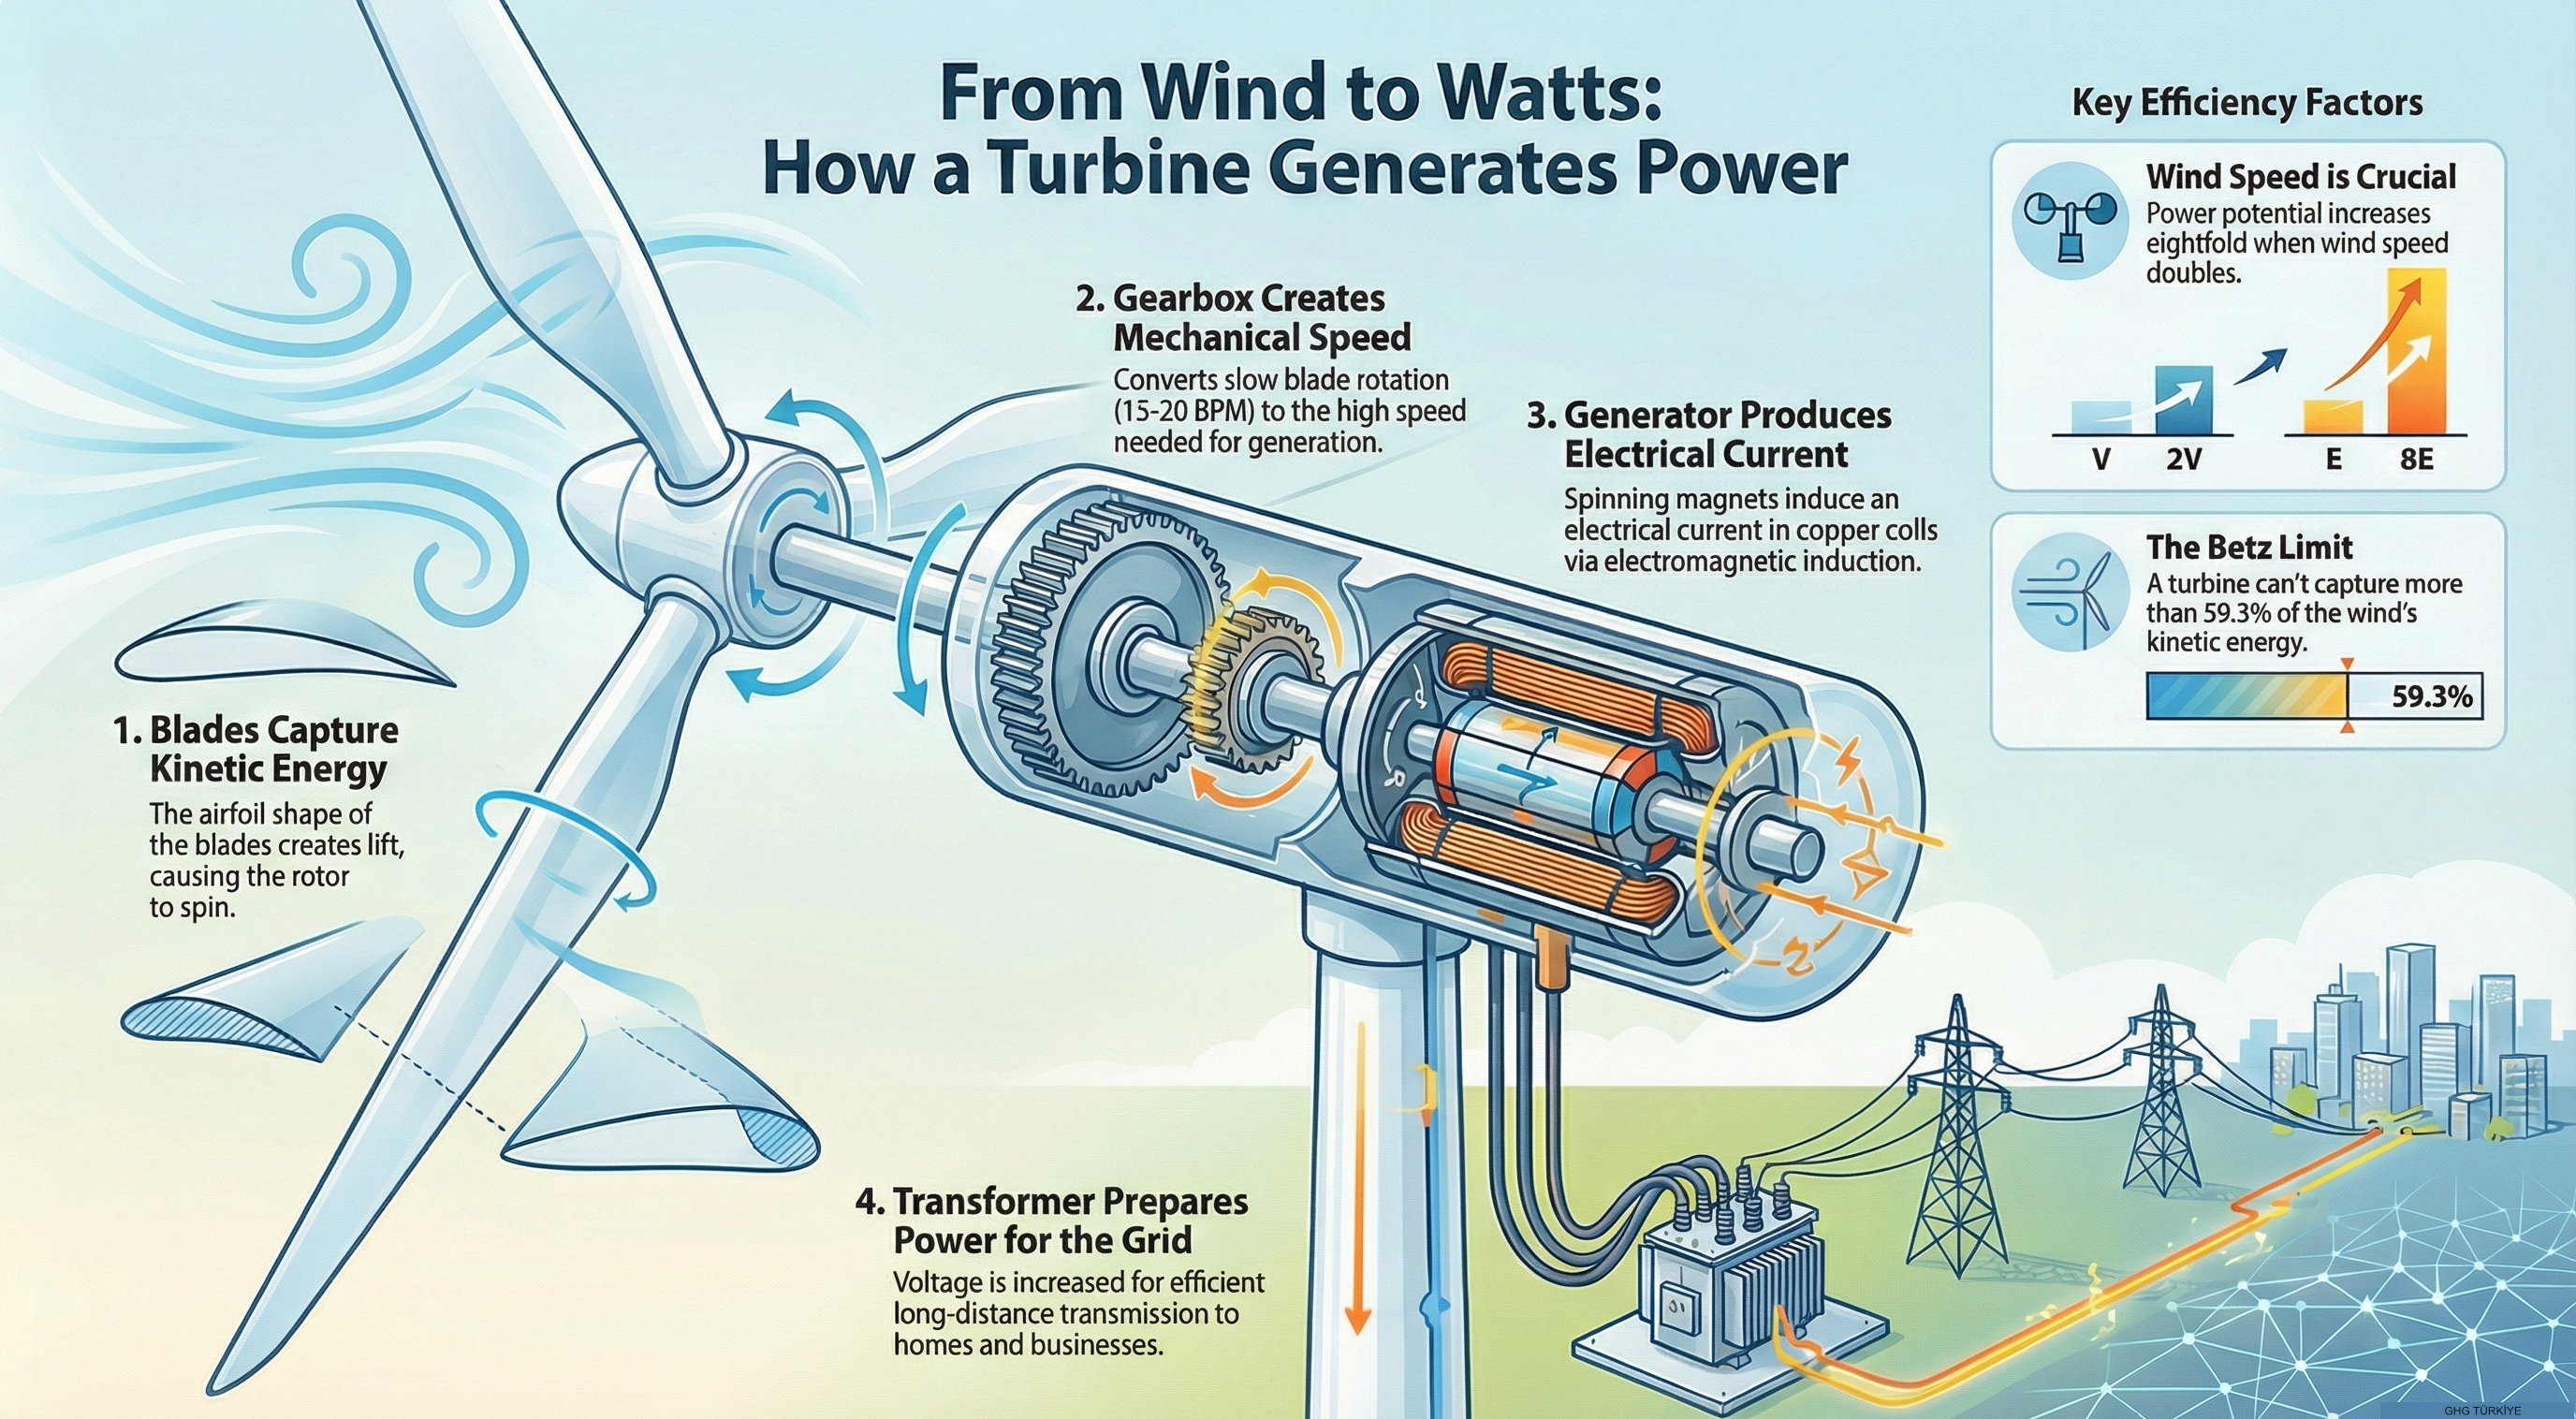
Infographic explaining the conversion process of wind kinetic energy into electrical energy and the main components of turbines (blades, rotor, generator).
Enteric Fermentation and Methane
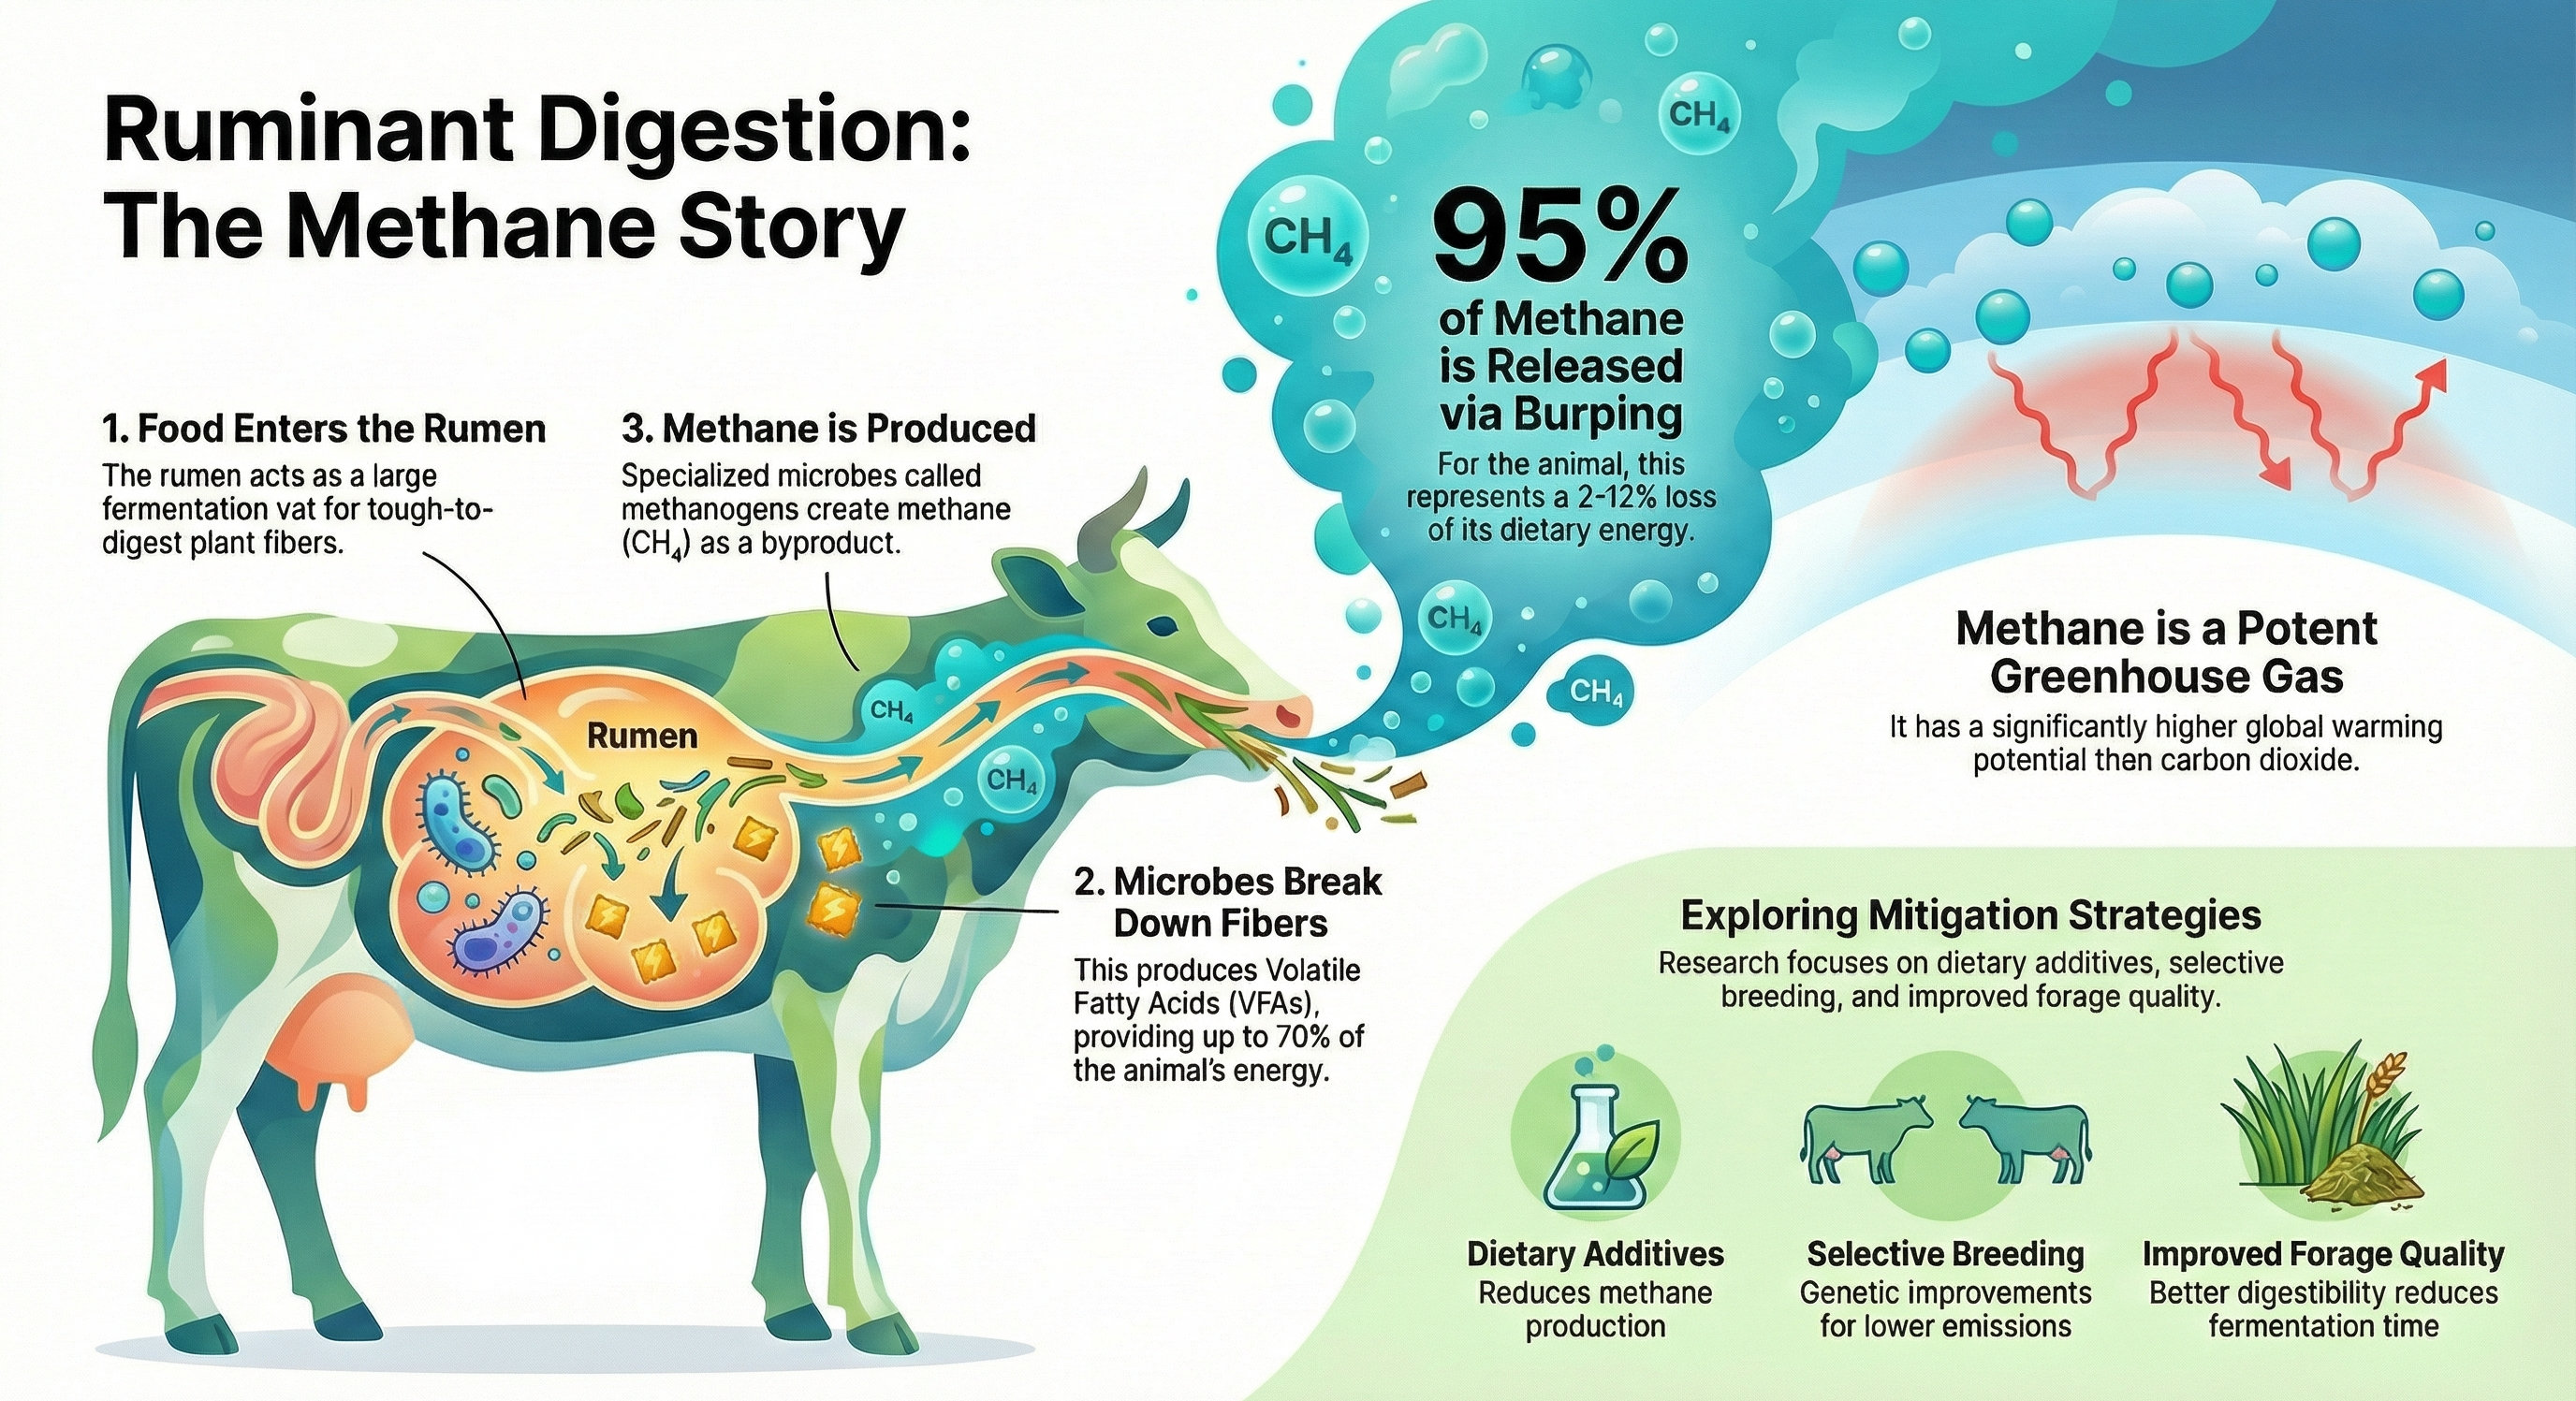
Infographic showing methane gas formation during the metabolic digestive processes of ruminant animals (cows, sheep, etc.) and its impact on climate change.
Wastewater Treatment and Greenhouse Gases
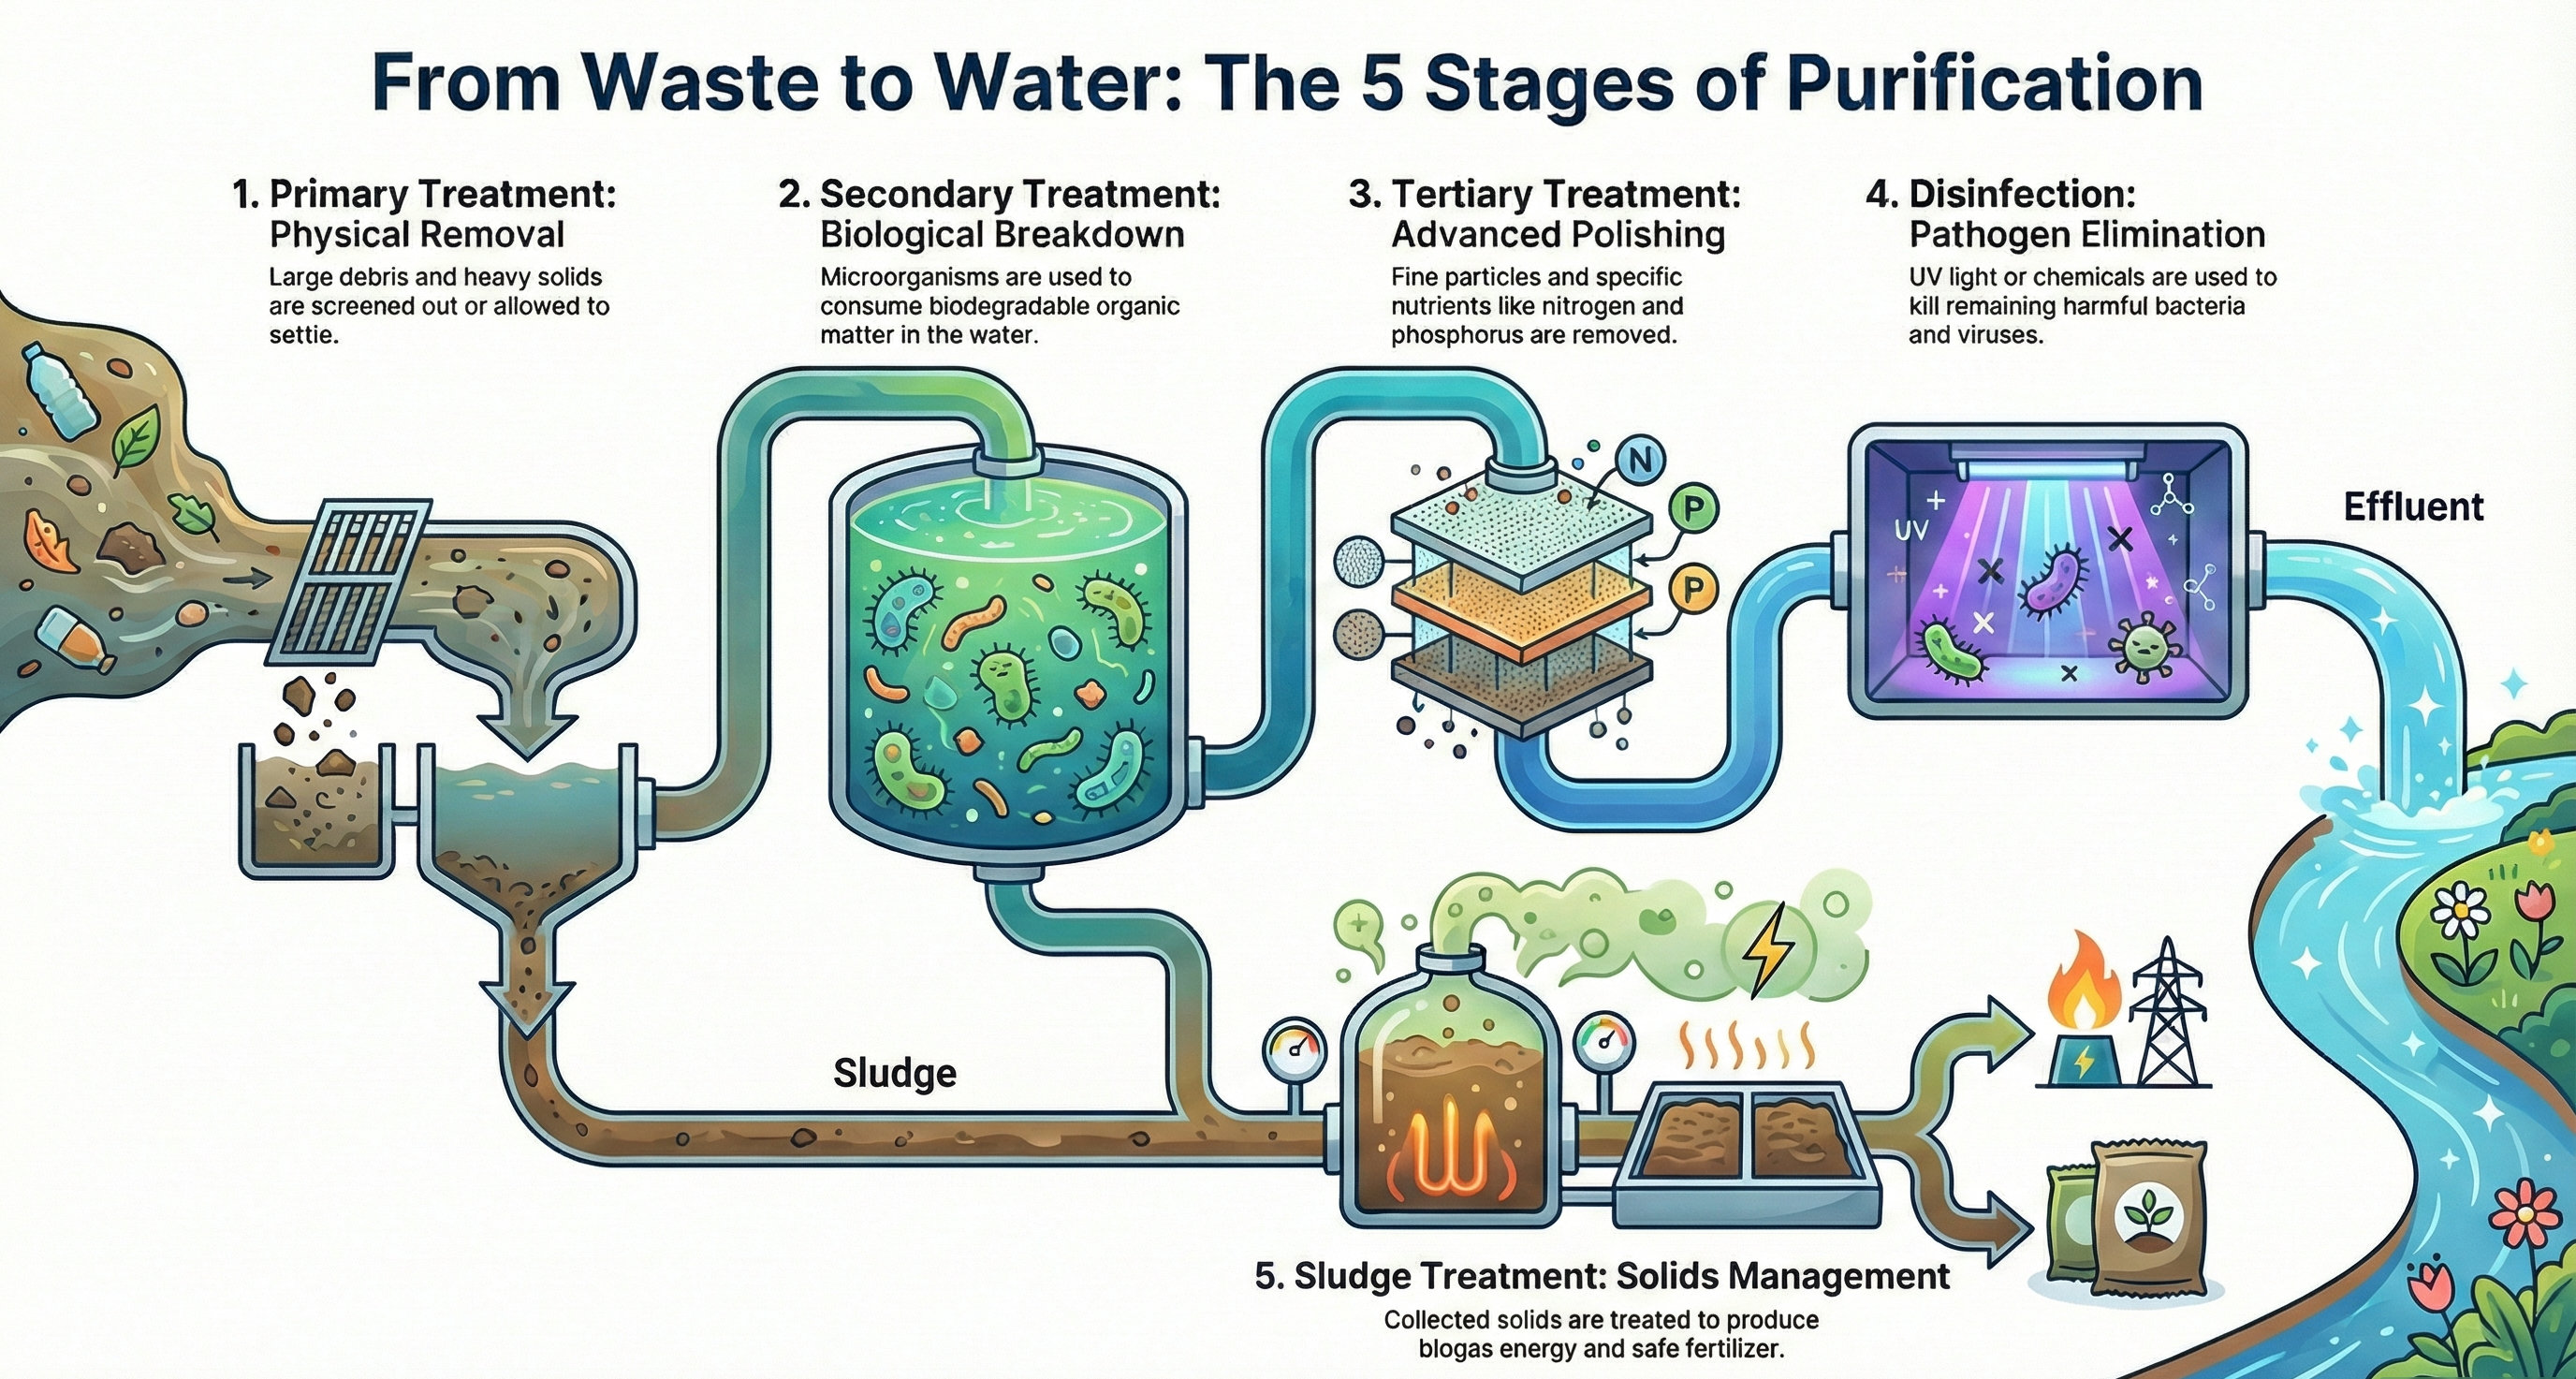
Infographic showing methane (CH₄) and nitrous oxide (N₂O) emissions generated during the decomposition of organic matter in wastewater treatment plants.
Landfill Gas and Energy Recovery
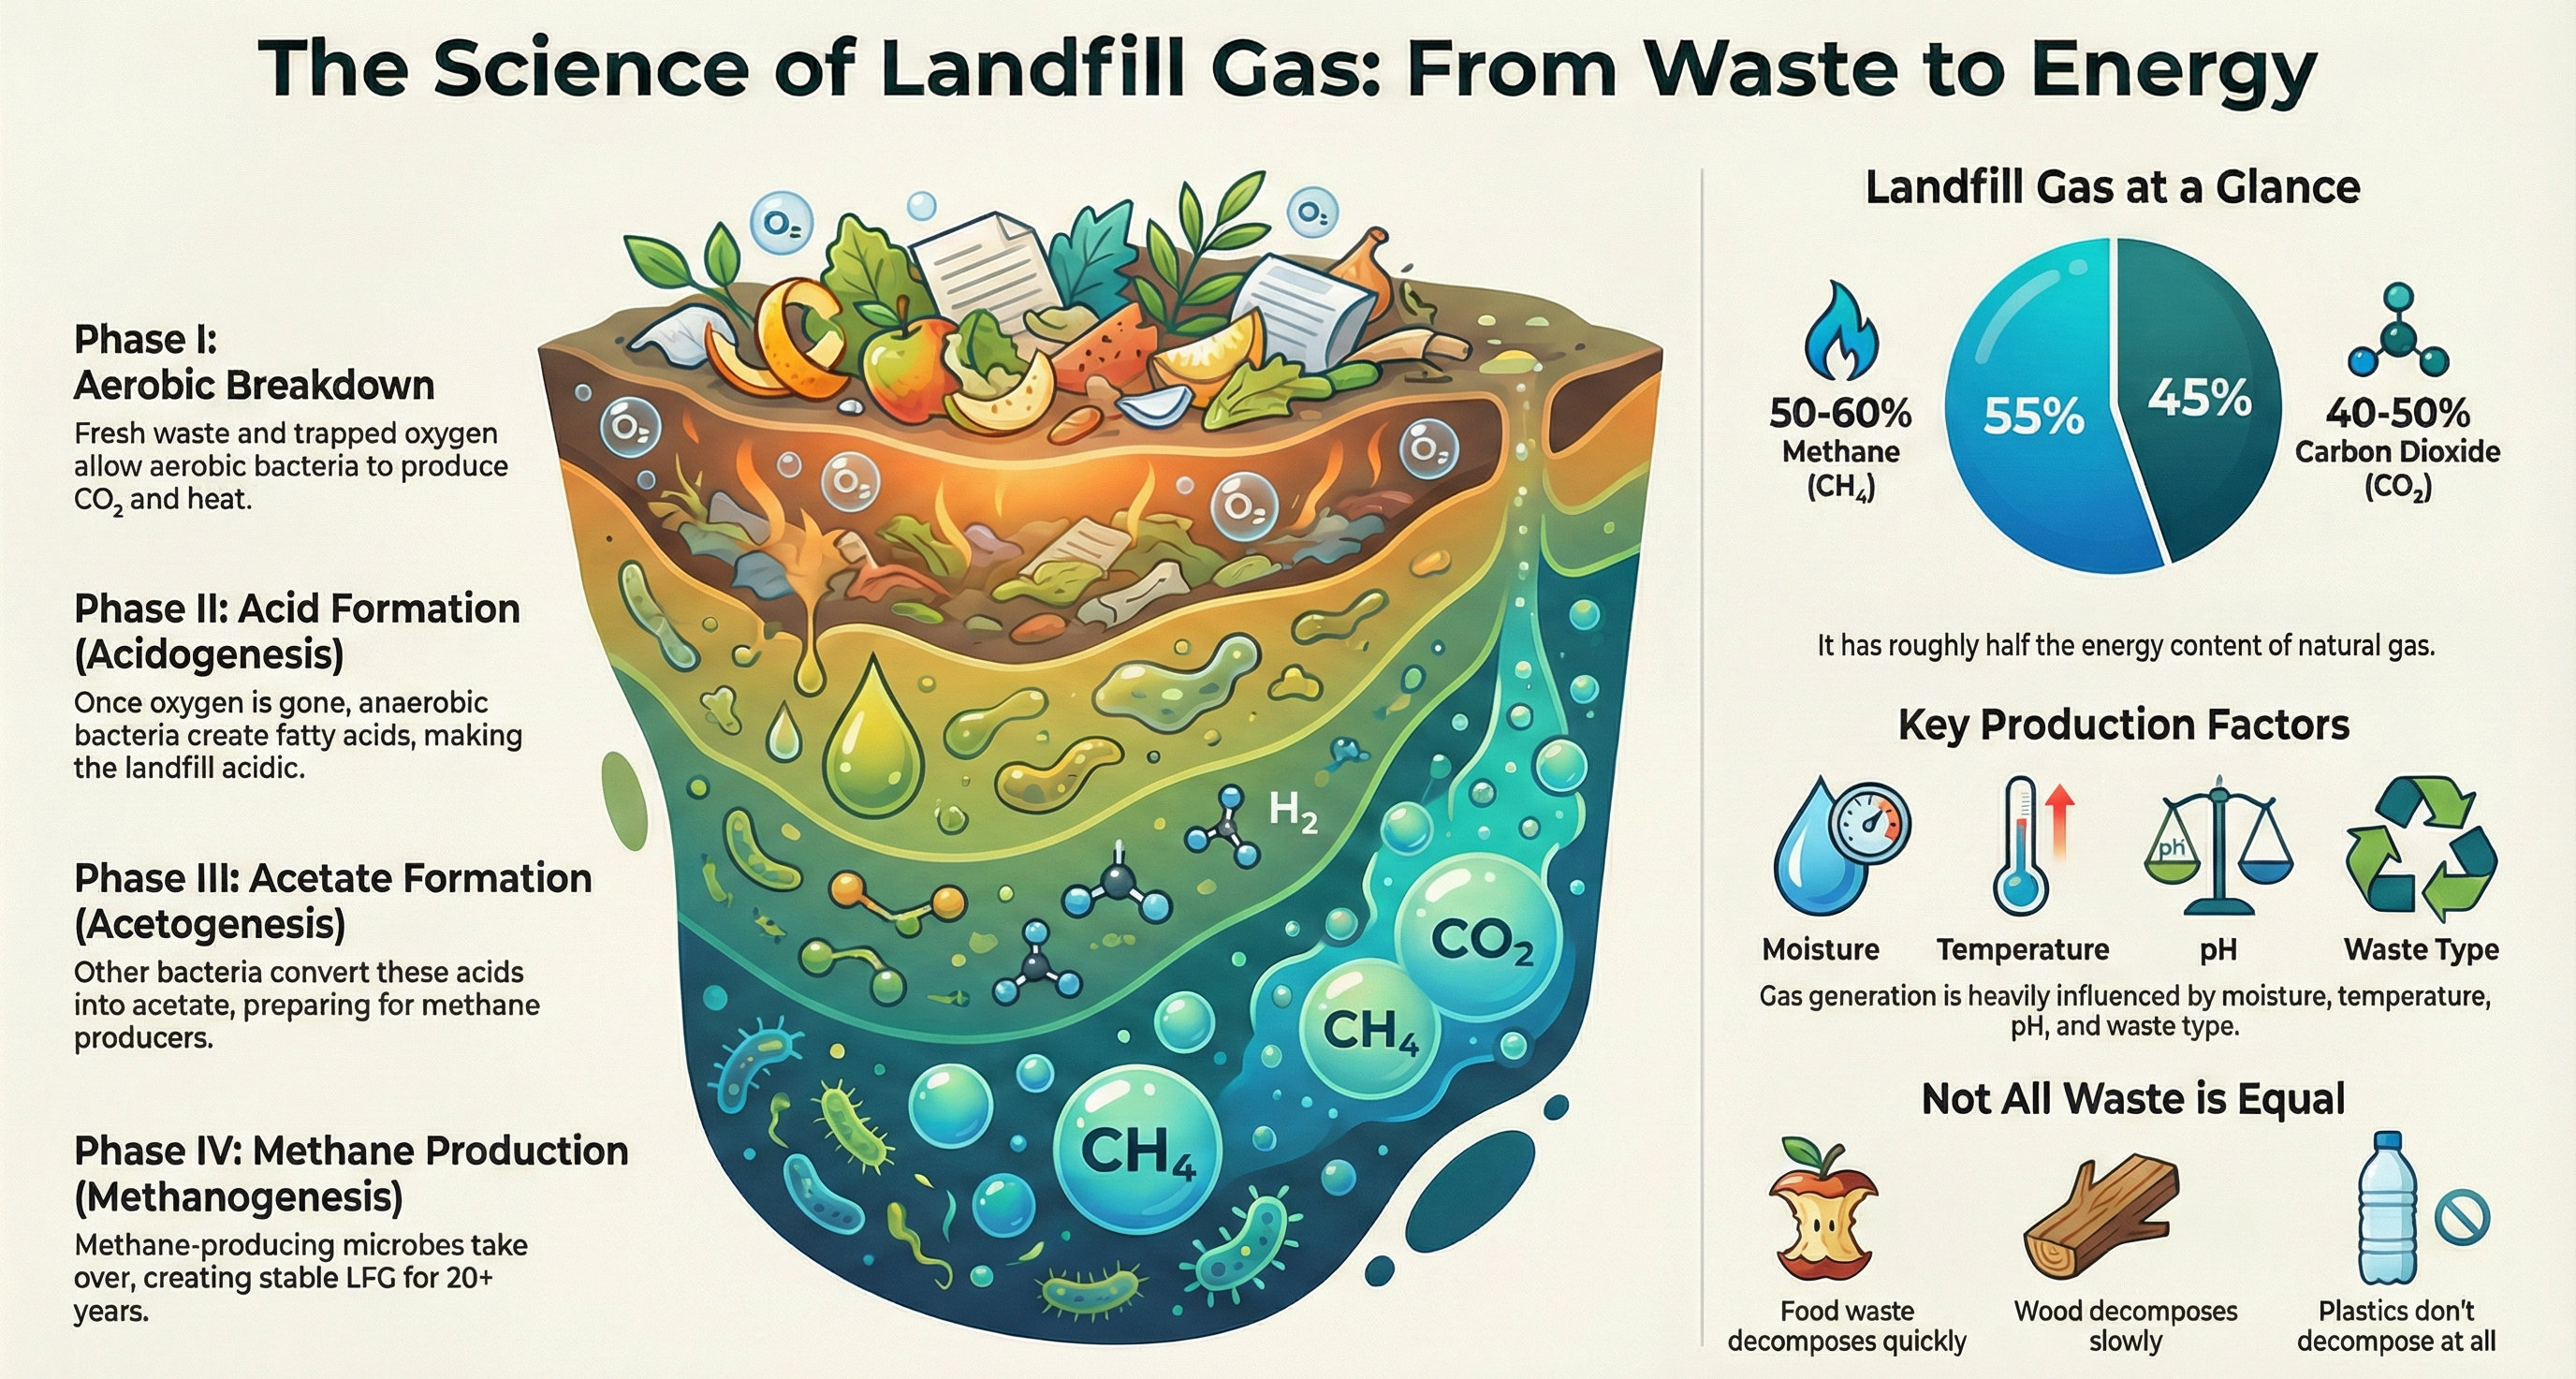
Infographic showing the formation of landfill gas (LFG) resulting from the anaerobic decomposition of waste in landfills and its use in energy production.
What is a Carbon Sink?
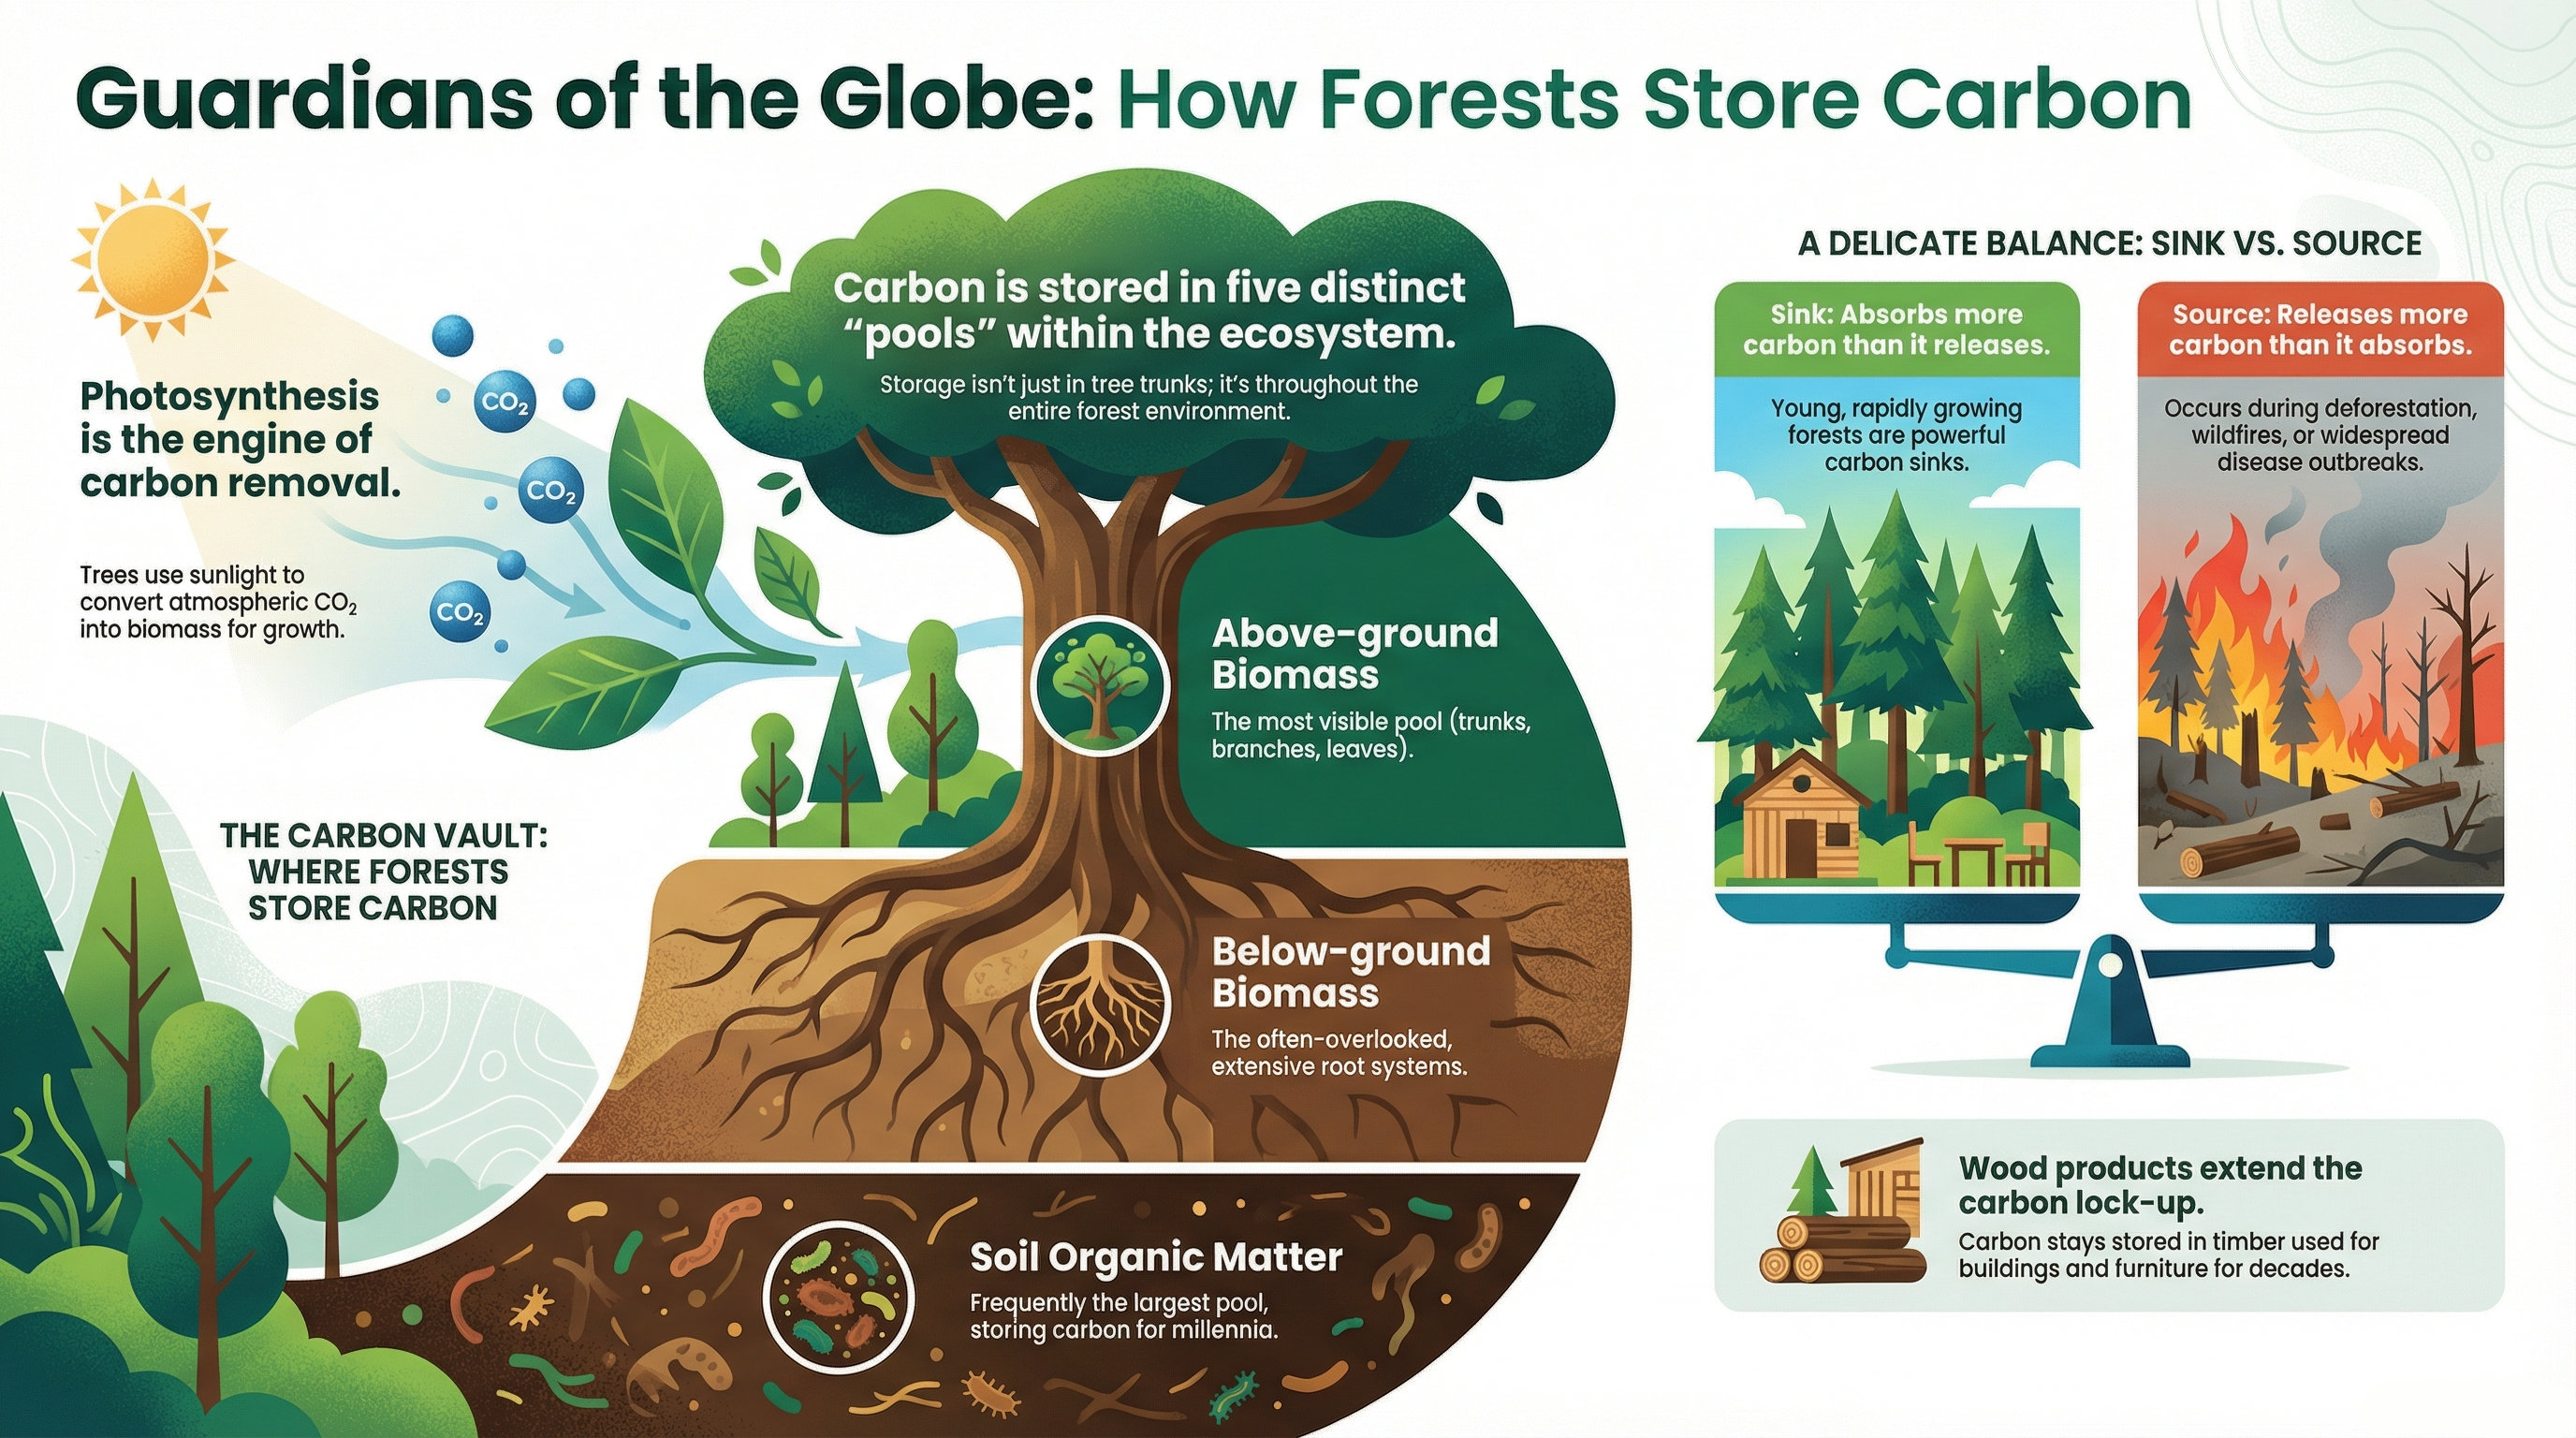
Infographic explaining how natural systems like forests, oceans, and soil absorb and store carbon dioxide from the atmosphere (acting as sinks).
Carbon Pricing Mechanisms
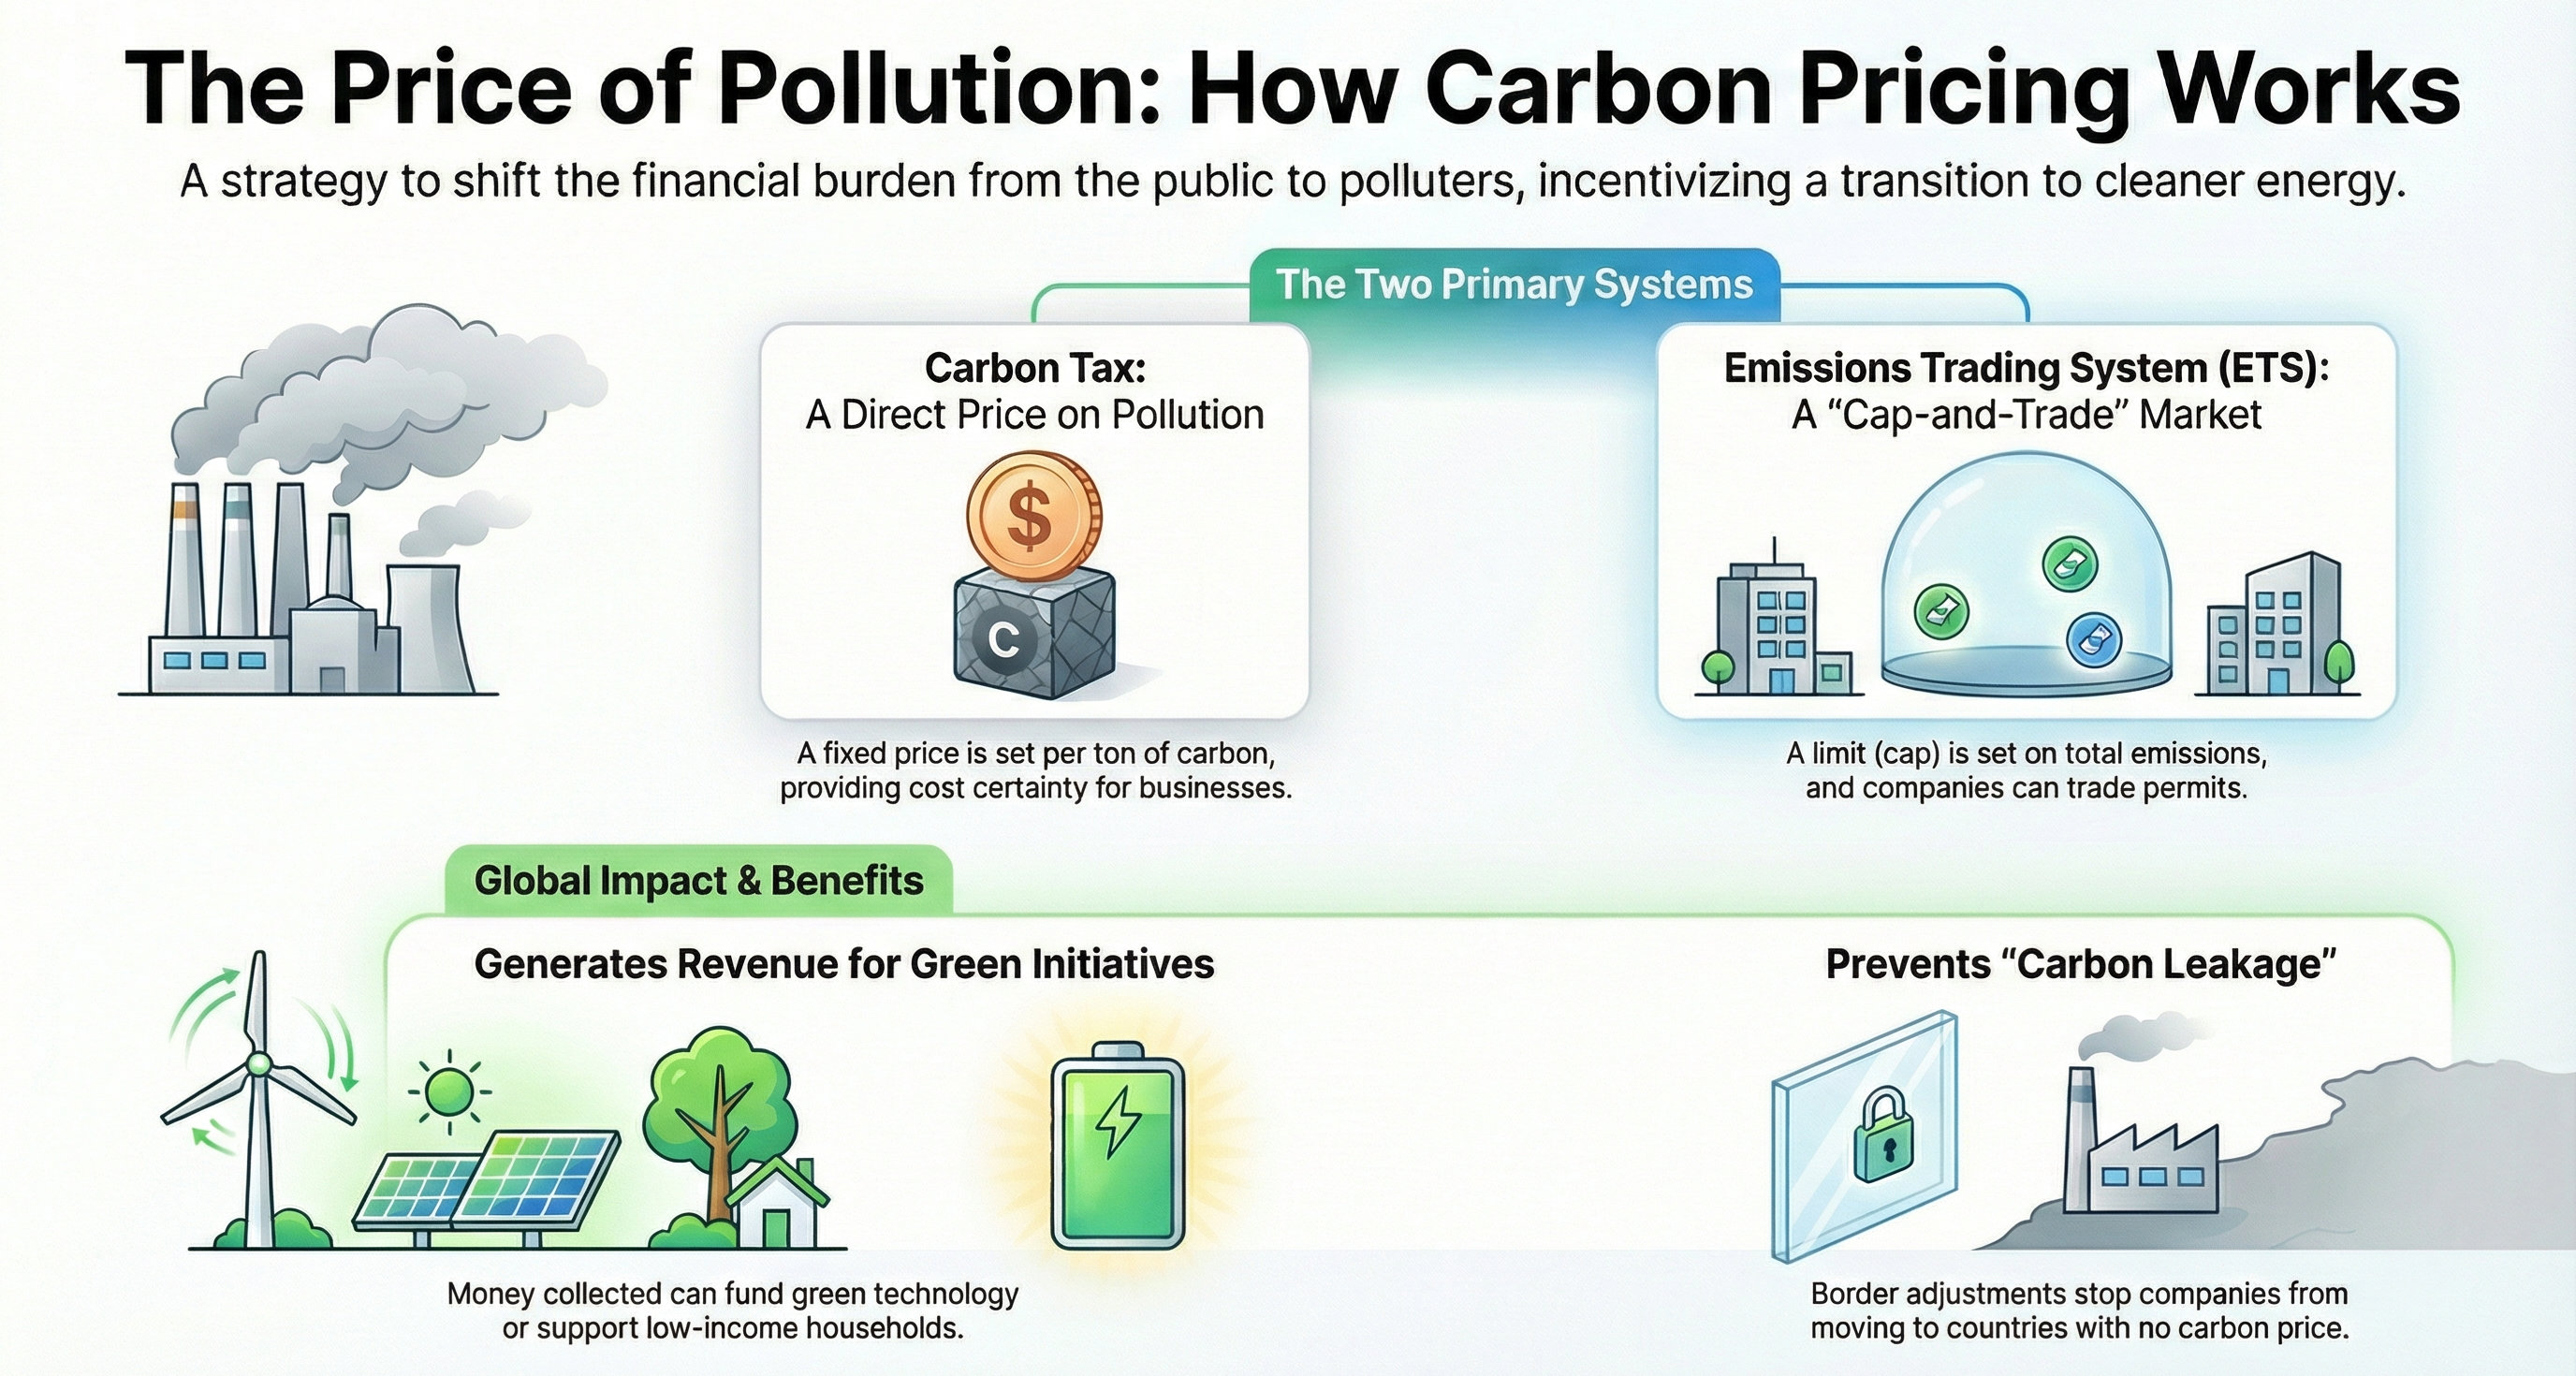
Infographic explaining how carbon pricing instruments like carbon taxes and emissions trading systems (ETS) work and their impact on emission reduction.