
Every COP ends with a list of pledges, and in Antalya the list is growing again. Some come from countries that emit hundreds of millions of tonnes a year, others from countries whose entire output is smaller than a single large power plant elsewhere. They are announced from the same podium and reported in the same headlines, but they are not the same size. This piece puts numbers on that difference using the newest global dataset, EDGAR 2026, and checks it against the countries’ own official inventories: who emits how much, how concentrated the total is, and which sectors drive the five largest emitters.
Data as of 13 November 2026. EDGAR 2026 (European Commission Joint Research Centre) covers 2025 and counts all greenhouse gases as CO₂-equivalent with 100-year global warming potentials from IPCC AR5, excluding land use, land-use change and forestry (LULUCF). National figures come from the latest reports submitted to the UNFCCC, which cover earlier years. “Mt” is a million tonnes, “Gt” a billion tonnes.
The short version
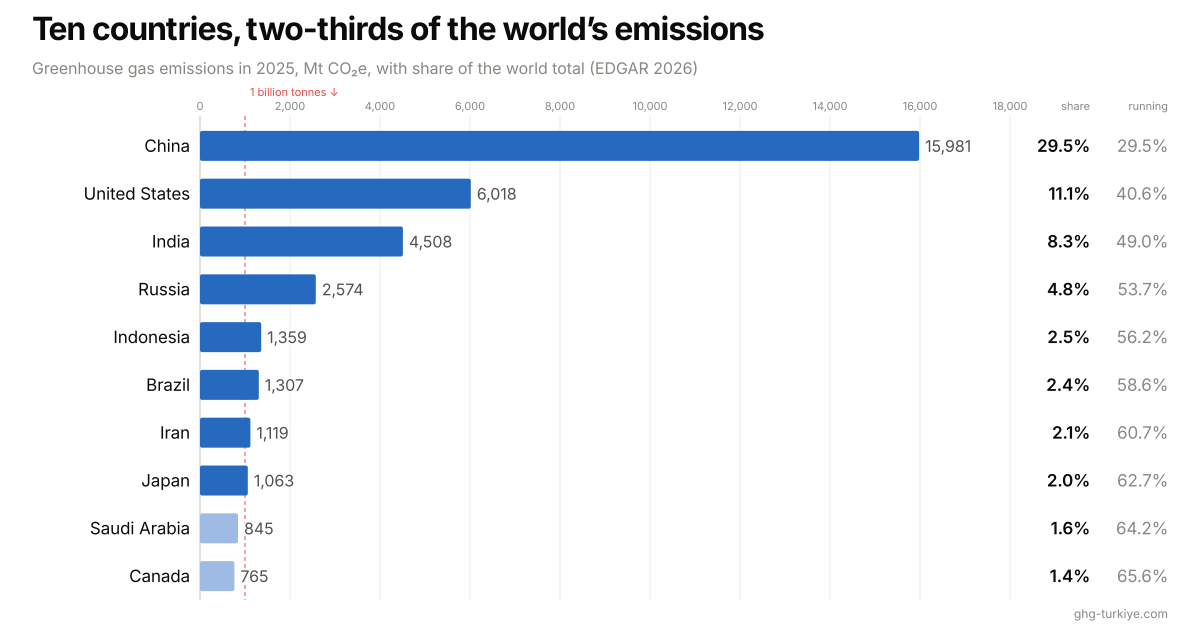
The world emitted 54.1 billion tonnes of greenhouse gases in 2025, 0.7% more than in 2024 and 11.5% more than in 2015, the year the Paris Agreement was adopted. Three countries (China, the United States and India) account for 49% of it, the top five for 56% and the top ten for 66%. Eight countries emit more than a billion tonnes each, together 62.7%. At the other end, the 104 smallest emitters, half of all countries, add up to 1.8%. China’s emissions growth since 2015 alone (2.9 billion tonnes) is larger than the combined annual output of the 131 smallest emitters. In four of the five largest emitters, power generation is the biggest single source; the exception is the United States, where transport comes first. Independent assessments put the 1.5 °C-compatible level for China, the United States and Russia in 2035 at well under half of where current policies lead, and for India at about half if international finance is provided. What holds them back is less technology than decisions on coal, grids, methane and how targets are written.
1. The world total in 2025
EDGAR puts global greenhouse gas emissions in 2025 at 54,149 Mt CO₂e, up 380 Mt (+0.7%) from 2024. That is 11.5% above 2015 (48,551 Mt) and 68% above 1990 (32,137 Mt). Emissions are still rising, just more slowly than in the 2000s. CO₂ makes up 73.8% of the total, methane 17.6%, nitrous oxide 5.3% and fluorinated gases 3.3%.
By source, power generation is the largest single sector at 29.2%, followed by transport (16.2%), agriculture (11.7%), fuel combustion in industry (11.5%) and fuel production (11.3%, which covers coal mining, oil and gas extraction, refining and the methane that leaks along the way). Industrial processes such as cement and chemicals add 9.9%, buildings 6.6% and waste 3.6%. International shipping and aviation, which EDGAR does not assign to any country, emit 1,387 Mt between them, 2.6% of the total.
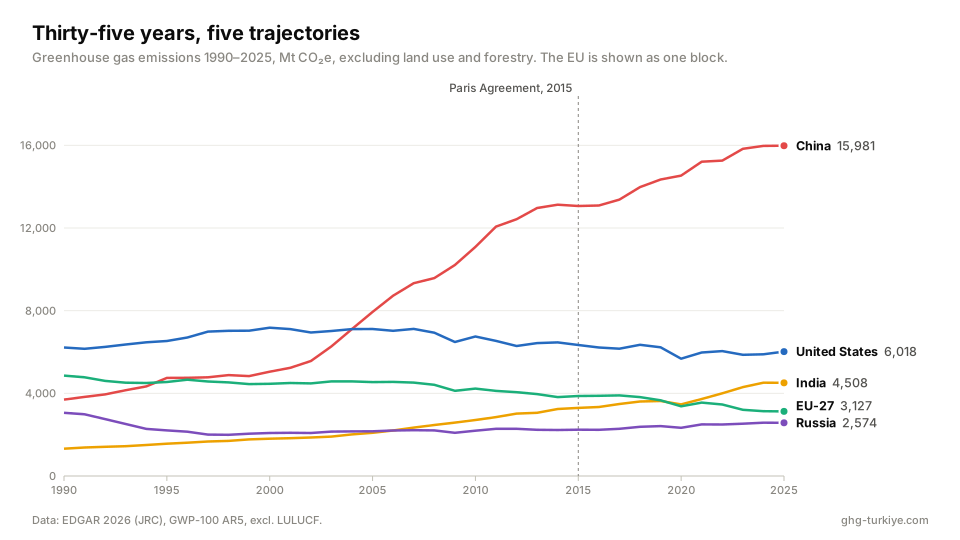
The long view explains today’s ranking. China’s emissions have more than quadrupled since 1990; they passed the European Union’s in 1995 and the United States’ in 2004. India’s have more than tripled, overtaking Russia in 2007 and the EU in 2020. Over the same 35 years the EU cut its emissions by 36% and Russia’s fell 16%, almost all of it in the collapse of the early 1990s. The United States peaked in 2000 and is only 3% below its 1990 level.
2. Who emits how much
| # | Country | 2025 (Mt CO₂e) | Share of world | Running total | Per person (t) | Change since 2015 |
|---|---|---|---|---|---|---|
| 1 | China | 15,981 | 29.5% | 29.5% | 11.1 | +22.3% |
| 2 | United States | 6,018 | 11.1% | 40.6% | 17.5 | −5.1% |
| 3 | India | 4,508 | 8.3% | 49.0% | 3.1 | +36.8% |
| 4 | Russia | 2,574 | 4.8% | 53.7% | 18.1 | +14.8% |
| 5 | Indonesia | 1,359 | 2.5% | 56.2% | 4.8 | +53.6% |
| 6 | Brazil | 1,307 | 2.4% | 58.6% | 5.9 | +5.9% |
| 7 | Iran | 1,119 | 2.1% | 60.7% | 12.9 | +40.2% |
| 8 | Japan | 1,063 | 2.0% | 62.7% | 8.6 | −19.9% |
| 9 | Saudi Arabia | 845 | 1.6% | 64.2% | 22.7 | +11.9% |
| 10 | Canada | 765 | 1.4% | 65.6% | 19.5 | +0.9% |
| World | 54,149 | 100% | 6.6 | +11.5% |
Running totals are computed from unrounded values, so they can differ by 0.1 point from the sum of the rounded shares.
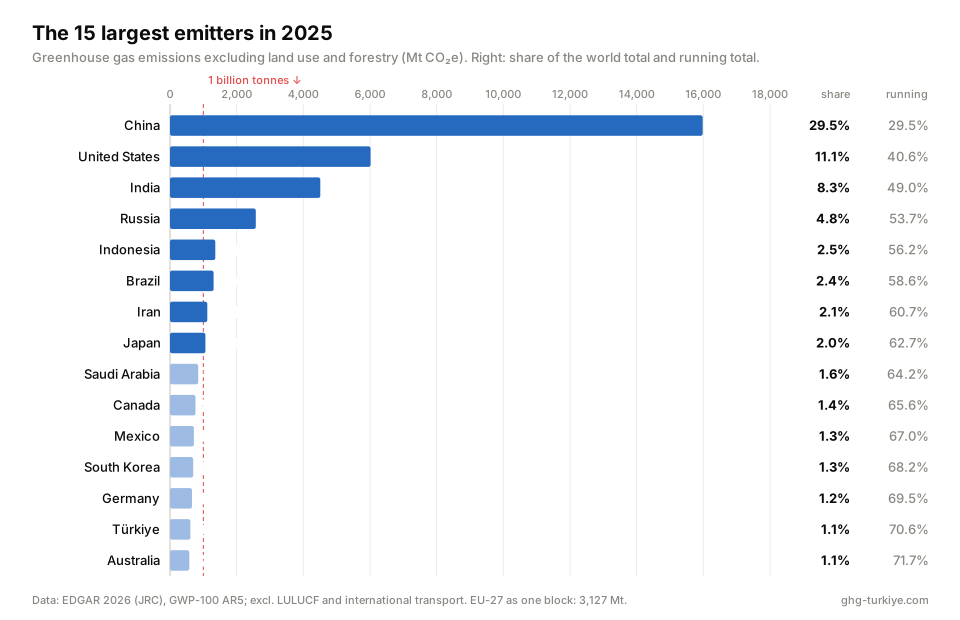
China alone emits more than the next four countries put together. If the European Union is counted as one block (3,127 Mt, 5.8%), it would rank fourth, ahead of Russia. Türkiye ranks 14th among countries with 611 Mt, 1.1% of the world total and 7.1 tonnes per person (16th in tables that also list international shipping and aviation as rows); its own national inventory gives 585 Mt for 2024. The ranking for every country, with per-person and per-GDP figures, is on our Country Rankings page.
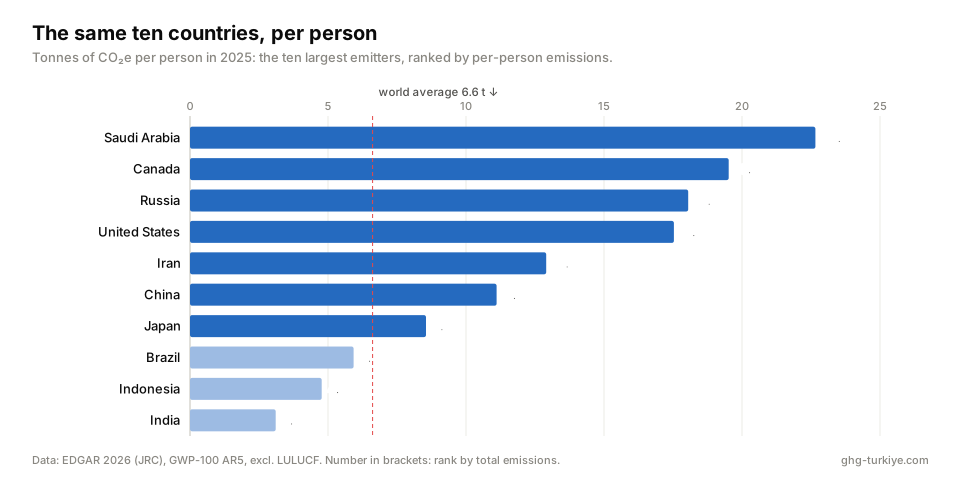
Per-person emissions tell a different story from the totals. An average person in Saudi Arabia, Canada, Russia or the United States is responsible for 17–23 tonnes a year; in India, 3.1 tonnes, below the world average of 6.6. India is the third-largest emitter because it has 1.4 billion people, not because each of them emits a lot. Both views are true, and both matter in climate negotiations: the total decides what happens to the atmosphere, while the per-person figure sits at the heart of every argument about fairness.
3. How concentrated is it?
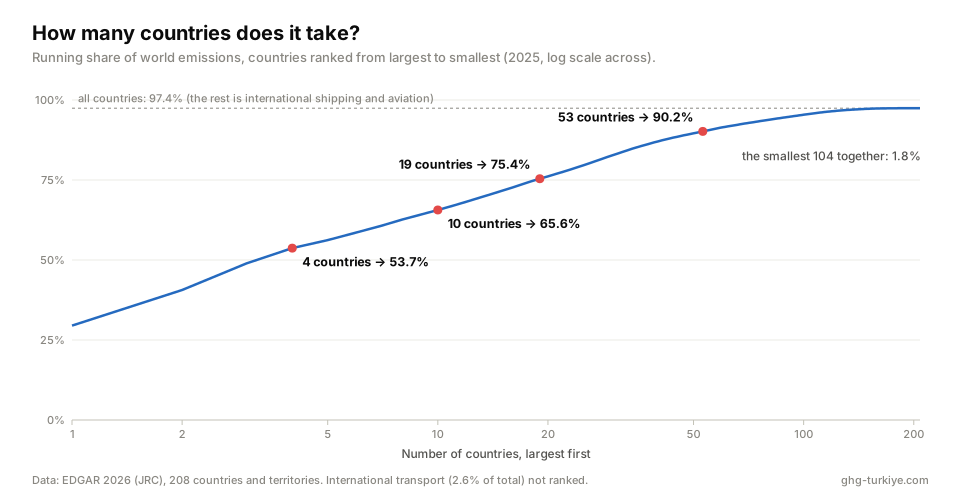
Line up all 208 countries and territories in EDGAR from largest to smallest and add them up one by one. The first four pass half of world emissions. Ten come close to two-thirds (65.6%), 19 reach three-quarters, and it takes 53 to cover 90%. The remaining 155 share about 7%; the last 2.6% is international shipping and aviation, which is not assigned to any country.
The “billion-tonne club” is eight countries: China, the United States, India, Russia, Indonesia, Brazil, Iran and Japan. Together they emit 62.7% of the world total; add the EU as a ninth member and it is 68.4%. At the bottom of the list, 131 countries each emit less than 0.1% of the total. Together they come to 2,135 Mt, or 3.9%. The smallest half, 104 countries, adds up to 965 Mt: 1.8%, less than Japan.
4. What this means for pledges at COP31
Before Antalya, the UNFCCC summed up the new national climate plans (NDCs) in its 2026 synthesis report. The 127 new NDCs from 154 Parties (the EU submits one joint NDC for its 27 member states), covering about 71% of global emissions, would leave emissions in 2035 around 6% below 2019 levels, or about 9% below if every pledge is implemented in full. The IPCC’s Sixth Assessment Report puts the cut needed by 2035 in 1.5 °C pathways at around 60% below 2019. The gap between those two numbers is decided mostly in a handful of capitals.
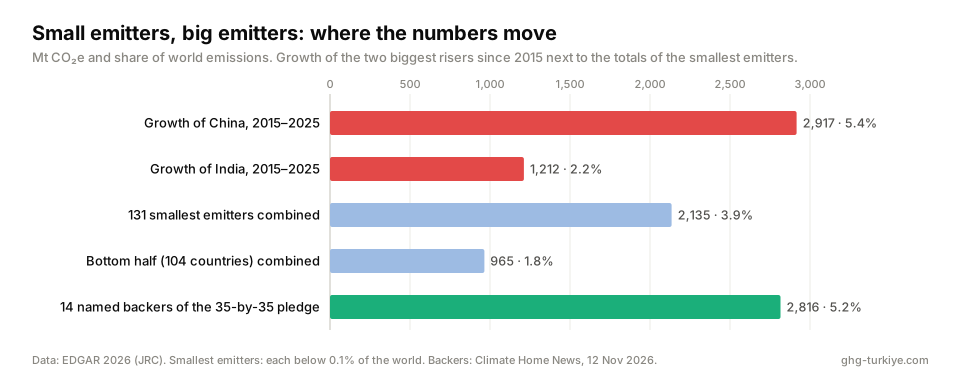
A few comparisons make the scale clear:
- If all 131 of the smallest emitters stopped emitting tomorrow, world emissions would fall by 3.9%. China’s increase since 2015 alone is 2,917 Mt (5.4% of today’s world total), more than everything those 131 countries emit in a year.
- The COP31 Presidency’s flagship 35-by-35 electrification pledge (raising electricity’s share of global final energy use from 23% to 35% by 2035) had 14 named government backers on 12 November: Australia, Ethiopia, Germany, Norway, Finland, South Korea, Pakistan, Zimbabwe, Eswatini, Togo, Liechtenstein, Palau, Seychelles and the Solomon Islands. Together they emit 2,816 Mt, 5.2% of the world total. A day later the count was at least 15, with the United Kingdom among them, which brings the share to 5.9%. On 14 November the count was still at least 15, according to Climate Home News, and some large developing countries had pushed back all week against putting sectoral targets, this pledge among them, into a cover decision. The EU is expected to join once its member states approve; that would take it to about 10%.
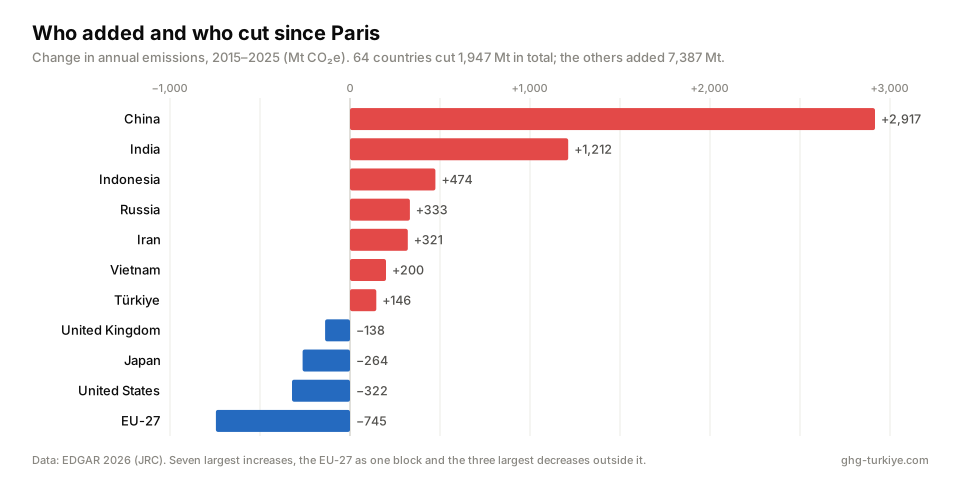
The same imbalance shows in what has happened since Paris. World emissions grew by 5,598 Mt between 2015 and 2025; China accounts for 52% of that and India for 22%, so three-quarters of the net growth comes from two countries. Cuts did happen: 64 countries emitted less in 2025 than in 2015, for a combined 1,947 Mt. The largest cuts came from the United States (−322 Mt), Japan (−264 Mt) and Germany (−242 Mt); the EU as a whole cut 745 Mt. The other countries added 7,387 Mt, almost four times as much. (The remaining 158 Mt of the net growth came from international shipping and aviation.)
None of this makes small countries’ commitments pointless. Their NDCs are largely about adapting to impacts they did little to cause, they are often conditional on finance, and small island states have long been the moral force behind the 1.5 °C goal. Some mid-sized emitters are also growing fast enough to matter within a decade: Vietnam’s emissions are up 58% since 2015. But for the global emissions curve, the arithmetic is unforgiving: a pledge is worth what it covers. That is why what the five largest emitters have put on the table deserves a close look:
| Country | Share of world (2025) | 2035 commitment | What it means in practice |
|---|---|---|---|
| China | 29.5% | Cut economy-wide net emissions 7–10% from their peak by 2035; peak CO₂ before 2030 | Emissions were flat in 2025 (+0.1%). The target names no peak year or peak level, so the actual cut depends on where the peak lands. |
| United States | 11.1% | None: withdrawal from the Paris Agreement took effect on 27 January 2026 | No NDC in force, and no greenhouse gas inventory submitted to the UNFCCC in 2026. US emissions rose 2.2% (131 Mt) in 2025, the largest absolute increase of any country. |
| India | 8.3% | Cut emissions intensity of GDP 47% from 2005 by 2035; 60% non-fossil power capacity | An intensity target, not a cap: absolute emissions can keep rising as long as the economy grows faster. They are up 36.8% since 2015. |
| Russia | 4.8% | Emissions at 65–67% of the 1990 level by 2035, counting forest sinks | By Russia’s own 2026 inventory, net emissions including forests were already at 42% of 1990 in 2024 (68% without them), so the target leaves room to grow. |
| Indonesia | 2.5% | Peak by 2030, then 1,258–1,489 Mt in 2035 including land use | The 2035 range brackets the 1,383 Mt reported for 2022. Emissions excluding land use are up 53.6% since 2015. |
5. What drives emissions in the five largest emitters
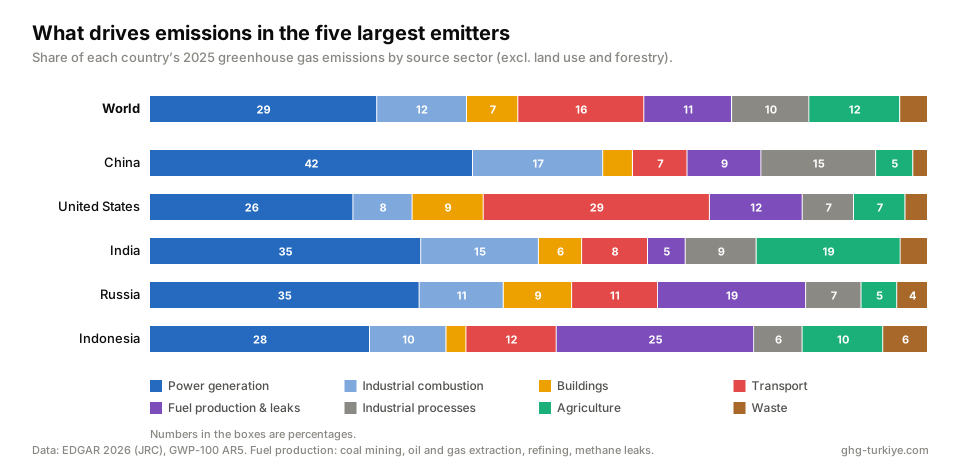
EDGAR splits each country’s emissions into the same eight source sectors, which makes the structure easy to compare. National inventories group things a little differently (they follow the IPCC categories of energy, industrial processes, agriculture, waste and land use) and usually lag two to four years behind, but they are the official numbers and they also report forests and land, which EDGAR leaves out. So each country below is shown both ways.
China: coal power and heavy industry. Power generation is 41.5% of China’s emissions, fuel burned in factories 16.7%, and industrial processes, mainly cement, steel and chemicals, another 14.8%. Together, nearly three-quarters of the total comes from making electricity and materials. Transport is only 7%. China’s first Biennial Transparency Report gives 14,314 Mt for 2021 excluding land use, of which energy is 76.9%, industrial processes 14.9%, agriculture 6.5% and waste 1.7%. Forests and land absorbed a net 1,315 Mt. EDGAR’s 2021 estimate (15,207 Mt) is about 6% higher.
United States: cars, trucks and power plants. The United States is the only top-five country where transport is the largest source (29.1%), ahead of power generation (26.1%). Fuel production, mostly oil and gas extraction and methane leaks, adds 11.9%. The latest official inventory (EPA, 1990–2023) puts gross emissions at 6,197 Mt in 2023. In EPA’s economic-sector view for 2022, transport is 28%, electric power 25%, industry 23%, homes and businesses 13% and agriculture 10%. EDGAR’s 2023 figure is about 5% lower (5,863 Mt).
India: coal power and farms. Power generation is 34.9%, but agriculture stands out at 18.5%, the highest share among the top five, from methane emitted by cattle and rice paddies and nitrous oxide from fertilisers. Industry adds 15.1%. India’s fourth Biennial Update Report gives 2,959 Mt for 2020 excluding land use, with energy at 75.7% and agriculture at 13.7%. EDGAR is noticeably higher for the same year (3,463 Mt, about 17% more). The two use different methods and emission factors; India’s targets are measured against the official figure.
Russia: an energy exporter’s footprint. Power and heat are 34.7%, and fuel production is 19.0%, well above the world share of 11.3%, because Russia extracts and moves vast amounts of oil and gas and methane escapes along the way. Russia’s 2026 national inventory reports 2,137 Mt for 2024 excluding land use, 32.4% below 1990. EDGAR is about a fifth higher (2,578 Mt for 2024). EDGAR’s gas breakdown is available only for 2025, when its total (2,574 Mt) is almost the same; on that basis the difference is split between CO₂ (about 1,790 Mt in the inventory against about 2,010 Mt in EDGAR) and methane (about 250 Mt against 430 Mt). Russia also reports a net land sink of 1,116 Mt, which brings its net total down to 1,021 Mt.
Indonesia: coal at both ends, and forests. Indonesia is the world’s largest coal exporter, and it shows: fuel production, mostly coal mining and its methane, is 25.4%, and power generation, mostly coal-fired, is 28.3%. Methane is 31.7% of Indonesia’s emissions, far above the world share. But EDGAR’s total leaves out what matters most here. Indonesia’s first Biennial Transparency Report puts 2022 emissions at 1,383 Mt including land use, with energy at 69.0% and land-use change including peat fires at 22.6%. In 2019, a severe fire year, the national figure was 1,845 Mt, half of it from land use and peat fires. Indonesia’s total can swing by several hundred million tonnes from one year to the next depending on what burns.
Brazil, sixth in EDGAR with 1,307 Mt, is a similar case: agriculture is 47.7% of its total excluding land use, and deforestation, which EDGAR does not count, has historically been its largest source.
6. What would it take? Country by country
The numbers so far describe the problem. The obvious next question is what the largest emitters would have to do differently. This section looks at the four that each emit more than 2 billion tonnes; Indonesia, fifth, is left out because its path to 2035 depends heavily on forests and peatland, which the figures here exclude. Two recent assessments give a yardstick. The UN Environment Programme’s Emissions Gap Report 2026 finds that, relative to 2025, global emissions would need to fall 18% by 2030, 45% by 2035 and 69% by 2040 to keep overshoot of 1.5 °C as small as possible and bring warming back to 1.5 °C by 2100; holding 2 °C would take 11%, 24% and 37%. Current policies point to about 2.8 °C of warming this century, and full implementation of all NDCs to about 2.6 °C. The Climate Action Tracker (CAT), an independent analysis by Climate Analytics and NewClimate Institute, reaches the same 2.6 °C if governments meet their 2030 and 2035 targets (2.7 °C under current policies) and translates the task into a pace: cuts of about 4% a year to 2030, 7% a year in the first half of the 2030s and 9% a year from 2035 to 2050. Every year of delay makes the curve steeper.
CAT also computes what each country would need to do, in two ways. The modelled domestic pathway asks where emissions would be cheapest to cut, regardless of who pays; here it is called the least-cost pathway. The fair share asks what each country should do with its own resources given its responsibility and capacity, with richer countries also expected to finance cuts elsewhere. The two can differ widely: India’s fair-share level for 2035 is about 50% higher than its least-cost level, and the difference is what international finance is meant to cover.
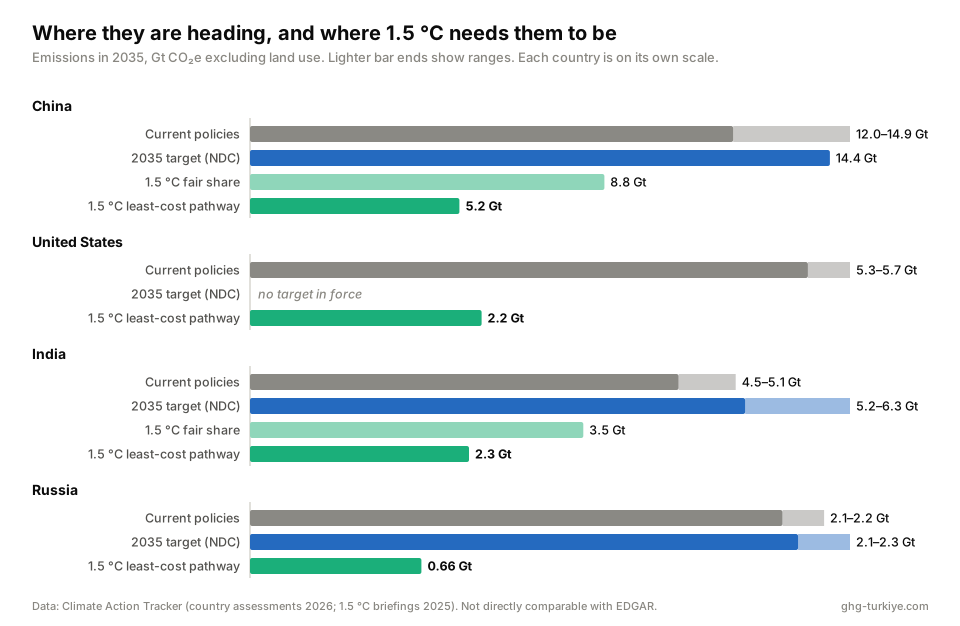
| Country | 2035 commitment (CAT’s reading) | 2035 under current policies (CAT) | 1.5 °C-compatible 2035 level (CAT, excl. land use) |
|---|---|---|---|
| China | 7–10% below peak (about 14.4 Gt) | 12.0–14.9 Gt | about 5.2 Gt (−66% vs 2023, least-cost); 8.8 Gt (−44%, fair share) |
| United States | none | 5.3–5.7 Gt | about 2.2 Gt (least-cost) |
| India | intensity −47% vs 2005 (5.2–6.3 Gt) | 4.5–5.1 Gt | about 3.5 Gt with its own resources (fair share); about 2.3 Gt with international support (least-cost) |
| Russia | 65–67% of 1990 counting forests (2.1–2.3 Gt without them) | 30–35% below 1990 (about 2.1–2.2 Gt) | about 0.66 Gt (−79% vs 1990) |
CAT figures are in CO₂-equivalent excluding land use and are not directly comparable with EDGAR’s, but the orders of magnitude are what matter. On the least-cost pathway, China, the United States and Russia would be at well under half of where current policies lead in 2035, and India at about half. In three of the four, the 2035 target sits inside or above the current-policy range, so it asks for no additional cut.
China: turn record clean power into falling coal use. China added 430 GW of wind and solar in 2025 alone and now has about 2,395 GW of renewable capacity, more than 60% of its power fleet; more than half of new cars sold are electric. Yet CAT notes that the new clean power mostly met rising demand rather than displacing fossil fuels, and curtailment is growing. At the same time the coal pipeline keeps expanding: Global Energy Monitor counted a record 161.7 GW of new and revived coal plant proposals in 2025 and 78.1 GW commissioned, a decade high, even though coal power generation fell 1.2%; at the end of the year 291 GW was permitted or under construction. The assessments point to four steps. First, a target against a fixed base year instead of an unspecified peak, because a 7–10% cut from a high, late plateau achieves little: CAT reads the target as about 14.4 Gt in 2035, inside the range current policies already deliver. Second, a halt to new coal approvals and a dated phase-out of unabated coal power, which CAT puts before 2040. Third, grids, storage and flexibility so that renewables push coal out instead of sitting curtailed. Fourth, methane: China is the world’s largest fossil-fuel methane emitter, with just over 25 Mt in 2025, almost 22 Mt of it from coal mines; the IEA estimates existing technology could cut that by more than half. For its own 2060 net-zero goal to stay credible, CAT says China needs at least a 27% cut from 2023 by 2035, well beyond what the NDC requires.
United States: stop the reversal first. The issue in the United States is not missing technology but policy going backwards. The One Big Beautiful Bill Act of July 2025 removed most of the clean-energy tax credits of the Inflation Reduction Act, in February 2026 the EPA rescinded the 2009 “endangerment finding” that underpinned federal greenhouse gas rules, and power plant and vehicle standards have been repealed. CAT now projects US emissions of 5.3–5.7 Gt in 2035, 13–18% higher than it projected in 2024 under the previous administration’s policies. US emissions rose by about 130 Mt in 2025, driven by growing electricity demand and a rebound in coal power, according to UNEP. The steps that would matter most follow from the sector mix: meet new electricity demand, including data centres, with clean power rather than by keeping coal plants open; restore vehicle standards in a country where transport is the largest source; and tackle oil and gas methane. North America emitted almost 24 Mt of fossil-fuel methane in 2025, just under 85% of it from the United States, mostly from venting tanks, leaks and gas-powered pneumatic devices. In 2025 Congress voided the rule implementing the federal methane fee (the Waste Emissions Charge) and postponed the fee itself to 2034. For now, the main levers left are state policies and the market: the IEA estimates that more than 35 Mt of the 124 Mt of methane the world’s fossil fuel sector emits each year could be avoided at no net cost at average 2025 energy prices.
India: from capacity to generation, and from intensity to an absolute target. India met its target of 50% non-fossil power capacity five years early, adding about 40 GW of solar and wind in 2025. But capacity is not generation: by CAT’s count renewables still supply only about a fifth of India’s electricity, and coal most of the rest, because grids and storage have not kept up. CAT’s 1.5 °C benchmark is renewables at 52–65% of generation by 2030 and 72–80% by 2035, with coal down to 17–19% by 2030 and effectively phased out by 2040. The coal pipeline is moving the other way: Global Energy Monitor counted 27.9 GW of new and revived coal plant proposals in India in 2025, and in the first half of 2026 construction started on 21.6 GW, as much as in the previous seven years combined. Three changes would make India’s commitments meaningful: generation targets instead of capacity targets; an economy-wide absolute emissions target instead of an intensity goal, since CAT expects the 2030 intensity target to be met under current policies and reads the 2035 NDC as 5.2–6.3 Gt, above the 4.5–5.1 Gt that current policies deliver; and a plan for methane from agriculture, a sector that makes up 18.5% of India’s emissions. Fairness matters most here. At 3.1 tonnes per person, India’s fair-share level for 2035 (about 3.5 Gt) is far above its least-cost level (about 2.3 Gt); closing that difference depends on international finance.
Russia: a target without forest accounting, and a methane plan. Russia’s 2035 target counts its forests, and its 2026 inventory raised the estimated forest sink sharply; CAT warns that relying on the land sink is risky because it is weakening globally and recalculations make the target hard to compare. Excluding land use, the 1.5 °C-compatible level is 657 Mt in 2035, 79% below 1990, against a target that allows 2,113–2,308 Mt (27–33% below 1990). Current policies already lead to 30–35% below 1990, so the target is weaker than doing nothing new. The Energy Strategy to 2050 keeps oil production near current levels, expands gas production and exports, keeps coal mining significant, and leaves solar and wind at about 1% of capacity and generation by 2050. The fastest, cheapest lever is methane. Russia has not joined the Global Methane Pledge, which now has 159 countries and the EU (China, India and Iran are also outside it); in 2025 its oil and gas sector released just under 10 Mt of methane and its coal mines nearly 4 Mt. Penalties are low and riddled with exemptions, and the IEA has no measured data for Russia at all. The IEA estimates that existing technology could cut Eurasia’s fossil methane by almost 70%, mainly from Russian oil and gas. Next would come a target set without forests and a dated plan to reduce fossil fuel production and exports.
Across the four, the common thread is clear: the technology is largely available, and what is missing is decisions about coal pipelines, grid investment, methane rules and how targets are written. China and India are building clean power faster than anyone; the question is whether it replaces coal. The United States has the means but has reversed course. Russia has written a target it already meets. What these four governments decide shapes the global curve far more than any number of small-country pledges.
Why EDGAR and national inventories differ
EDGAR estimates every country with one consistent method, using international energy statistics and default emission factors; that makes countries comparable and the data timely (2025 is already available). National inventories use country-specific data and factors, go through UNFCCC review and are the basis for NDC accounting, but they arrive later and are less comparable across countries. Neither is “the right number”. For the five largest emitters the two differ by roughly 5–20%, and the gaps are largest where methane from fossil fuel production and agriculture is uncertain, as in Russia and India. Land use is the other big difference: it is left out of EDGAR entirely, while for Indonesia and Brazil it can be the single largest item in the national inventory.
Caveats and limits
All shares here are of emissions excluding land use and forestry, in CO₂-equivalent with AR5 100-year warming potentials. A different metric, for example 20-year potentials that weigh methane more heavily, would raise the share of methane-heavy countries such as Indonesia, Brazil and India. Emissions are attributed where they are produced, not where the goods are consumed; on a consumption basis, the shares of importers such as the EU, the United States and Japan would be higher and China’s lower. The ranking reflects one year, while warming depends on cumulative emissions, where the United States and Europe weigh much more. The CAT pathways in section 6 are model results with wide ranges, they come from assessments published between mid-2025 and November 2026, and “fair share” is one of several possible equity approaches. UNEP’s global total for 2025 (58.4 Gt) is higher than EDGAR’s because it includes land use. The 35-by-35 backer list is the one reported on 12–14 November; the Presidency’s full list is expected later in the conference.
References
- European Commission, Joint Research Centre (2026). EDGAR — GHG emissions of all world countries, 2026 report. edgar.jrc.ec.europa.eu/report_2026
- UNFCCC (2026). Nationally determined contributions under the Paris Agreement: Synthesis report by the secretariat (2026 NDC Synthesis Report). unfccc.int
- UNFCCC (2026). National greenhouse gas inventory data for the period 1990–2024. FCCC/SBI/2026/21, Tables 5–7 and 9. unfccc.int
- UNFCCC (2026). Report on the technical expert review of the first biennial transparency report of China. FCCC/ETF/TERR.1/2024/CHN. unfccc.int; summary of China’s BTR1 inventory: Sino-German Cooperation on Climate Change
- UNFCCC (2025). Report on the technical expert review of the first biennial transparency report of Indonesia. FCCC/ETF/TERR.1/2024/IDN. unfccc.int
- Republic of Indonesia (2025). Second Nationally Determined Contribution. unfccc.int
- Government of India (2024). India: Fourth Biennial Update Report to the UNFCCC. unfccc.int; India’s NDC 2031–2035 (2026), UNFCCC NDC Registry
- US EPA (2025). Inventory of U.S. Greenhouse Gas Emissions and Sinks: 1990–2023. EPA 430-R-25-003. epa.gov
- IPCC (2023). Climate Change 2023: Synthesis Report, Summary for Policymakers, Table SPM.1. ipcc.ch/report/ar6/syr
- UNEP (2026). Emissions Gap Report 2026: The point of return. wedocs.unep.org; summary: Carbon Brief (21 October 2026), carbonbrief.org
- Climate Action Tracker (12 November 2026). Warming Projections Global Update: Without rapid action, the world is heading to irrecoverable overshoot. climateactiontracker.org
- Climate Action Tracker (2025). 1.5°C-compatible climate action and targets: China (June 2025) and India (August 2025). China, India
- Climate Action Tracker (2026). Country assessments: China (10 November 2026), India (9 September 2026), USA, policies and action (October 2026); 2035 NDC assessments: USA, Russian Federation
- Global Energy Monitor (May 2026). Boom and Bust Coal 2026. globalenergymonitor.org; mid-2026 update of the Global Coal Plant Tracker: globalenergymonitor.org
- Centre for Research on Energy and Clean Air and Global Energy Monitor (2026). Built to peak: Coal power expansion runs out of room in China. energyandcleanair.org
- IEA (4 May 2026). Global Methane Tracker 2026. Key findings, Regional insights
- Global Methane Pledge. Participants. globalmethanepledge.org
- Congressional Research Service (2026). Inflation Reduction Act Methane Emissions Charge: Overview and Considerations for Policymakers. R48906. everycrsreport.com
- Climate Home News (12 November 2026). COP31’s electrification pledge wins support with caveats on clean power and finance. climatechangenews.com; (13 November 2026) COP31 Bulletin Day 5; (14 November 2026) COP31 Bulletin Day 6
Every country’s 2025 emissions, per person and per unit of GDP, with sector and gas breakdowns, are on our Country Rankings page. For what these emissions mean for temperature, see How Much Has the World Warmed, and When Will It Reach 2 °C? If you notice an error, please let us know.