
Headlines about 1.5 °C can be confusing. Some say we have already crossed it, others that we are still a few years away. Often both are right, because they are measuring different things. I wanted to understand that difference properly, so I went through the latest temperature records, NOAA’s greenhouse gas measurements and the most recent scientific assessments step by step. This piece is the result. Every number comes from a published source, and each step can be repeated with a calculator.
If you would rather play with the numbers than read about them, the whole calculation runs live on our Global Greenhouse Gas Monitoring page, including a chart where you set the emissions path yourself.
Data as of 7 November 2026: NOAA greenhouse gas records to June–July 2026, HadCRUT5 temperatures to 2025, the Indicators of Global Climate Change 2025 assessment (Forster et al., 2026) and the Global Carbon Budget 2025 (Friedlingstein et al., 2026). Ranges in brackets follow the source: “likely” means a 66% probability range, “very likely” a 90% range.
The short version
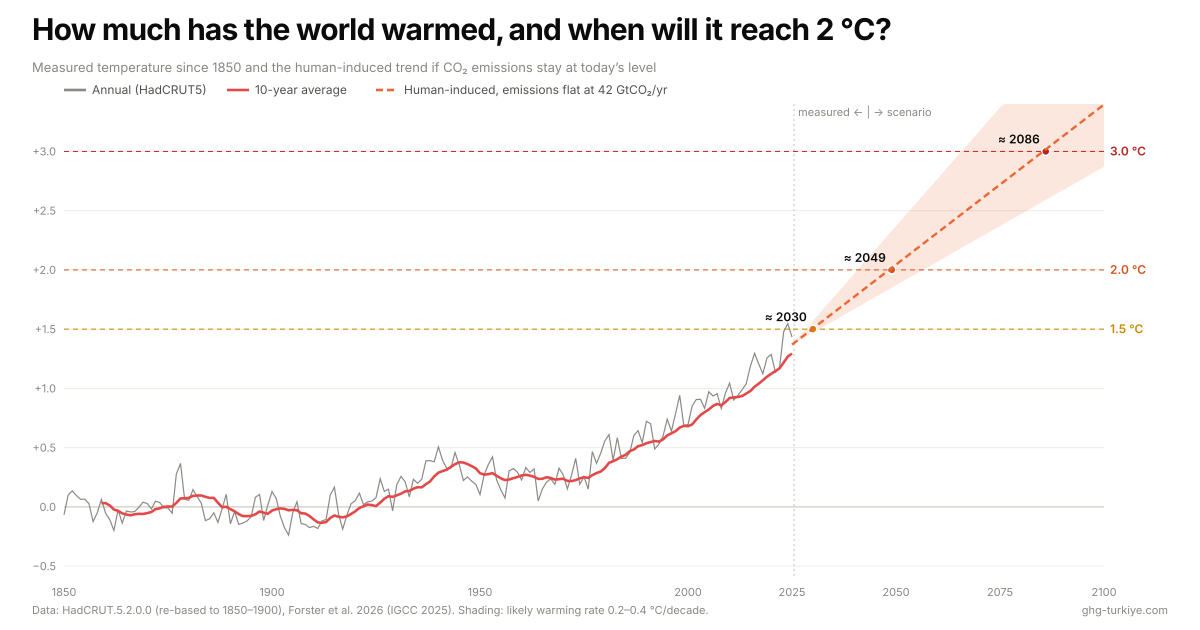
In the HadCRUT5 record, 2025 came out 1.43 °C warmer than the 1850–1900 average, and the last ten years averaged 1.29 °C. Take out the natural ups and downs and the human-caused part stands at about 1.37 °C (likely 1.1–1.7 °C), climbing by 0.27 °C every decade. If the world keeps emitting around 42 billion tonnes of CO₂ a year (about 55 billion tonnes once methane and the other greenhouse gases are counted as CO₂-equivalent), that trend crosses 1.5 °C around 2030, 2 °C around 2049 and 3 °C around 2086. The carbon budget for a 50:50 chance of holding 1.5 °C runs out during 2029; the one for 2 °C by the end of 2050.
1. What is actually in the air
Start with the measurements. NOAA’s Global Monitoring Laboratory collects air at remote sites around the world, far from cities and smokestacks, and turns the samples into a global monthly average. With the seasonal swings removed, the latest numbers look like this:
| Gas | Pre-industrial (1750) | Latest (NOAA, 2026) | Increase |
|---|---|---|---|
| Carbon dioxide (CO₂) | 278.3 ppm | 427.55 ppm (Jul) | +53.6% |
| Methane (CH₄) | 729.2 ppb | 1,942.1 ppb (Jun) | +166% |
| Nitrous oxide (N₂O) | 270.1 ppb | 340.0 ppb (Jun) | +25.9% |
| Sulphur hexafluoride (SF₆) | ≈ 0 | 12.70 ppt (Jun) | almost entirely human-made |
The pre-industrial values are the ones assessed by the IPCC (AR6 Working Group I, Chapter 2). Two things in the CO₂ record caught my eye. In 2024 the concentration jumped by 3.76 ppm, the biggest one-year rise NOAA has ever recorded; 2025 was calmer at 2.06 ppm. And over the last decade it has risen by 2.53 ppm a year on average, roughly three times the pace of the 1960s (0.82 ppm a year; before 1980 NOAA estimates the global rate from Mauna Loa and the South Pole). To make “ppm” a little more tangible: one ppm of CO₂ is 2.124 billion tonnes of carbon, or 7.78 billion tonnes of CO₂, using the conversion in the Global Carbon Budget. Using the 2025 annual mean of 425.6 ppm, that puts about 3,310 billion tonnes of CO₂ in the atmosphere.
2. How warm is it, compared with what?
“Pre-industrial” sounds vague, but in IPCC reports it has a precise meaning: the average of 1850–1900, the earliest stretch with enough measurements to estimate a near-global temperature. I used HadCRUT5 (Morice et al., 2021), the dataset maintained by the UK Met Office Hadley Centre and the Climatic Research Unit at the University of East Anglia, which combines land stations and sea-surface measurements back to 1850. There is one small trap: the files are published relative to 1961–1990, not to pre-industrial times. So the first step is to re-base the series on its own 1850–1900 average:
ΔT(year) = T(year) − mean of T(1850 … 1900)
In HadCRUT 5.2.0.0 that 1850–1900 average sits at −0.359 °C on the 1961–1990 scale. The file gives +1.073 °C for 2025, so against pre-industrial it is 1.073 − (−0.359) = +1.43 °C. Do the same for every year and the three warmest years on record come out as 2024 (+1.55 °C), 2023 (+1.48 °C) and 2025. The first nine months of 2026 averaged +1.49 °C.
A single year can be pushed up or down by El Niño or La Niña, so for long-term warming what counts is the average over many years. The ten years 2016–2025 come to +1.29 °C in HadCRUT5. The Indicators of Global Climate Change (IGCC) assessment, which averages four global datasets, gets 1.26 °C (very likely 1.13–1.36 °C) for the same decade. Two independent routes, 0.03 °C apart. I found that reassuring.
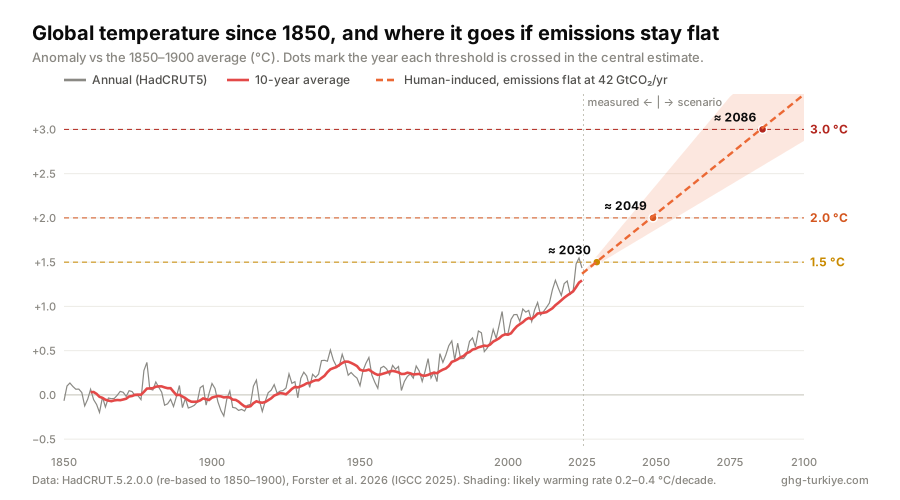
Try it yourself: this chart is interactive on the Global Greenhouse Gas Monitoring page. Move the emissions sliders and the years for 1.5, 2 and 3 °C update straight away. When you share the chart, the link opens with your scenario.
Measured temperature still includes natural variability: El Niño, volcanic eruptions, the solar cycle. IGCC separates out the human signal using three independent attribution methods and puts human-induced warming in 2025 at 1.37 °C (likely 1.1–1.7 °C). Why not 1.43 °C? Two small reasons. First, IGCC averages four datasets, and on that basis 2025 was 1.39 ± 0.13 °C warmer than 1850–1900, a little below HadCRUT5 on its own (on the same basis 2024 was 1.51 °C). Second, the remaining 0.02 °C is natural variability: IGCC finds that 2025 was a fairly typical year for today’s level of forced warming. For the 2025 human-induced value IGCC uses the trend-based definition from the IPCC’s 1.5 °C report, which in recent years gives practically the same result as the annual mean. Over 2016–2025 the human-induced figure rose by 0.27 °C per decade. The breakdown surprised me more than the total: greenhouse gases on their own account for +1.63 °C, and other human influences, mostly aerosol pollution, pull that back by −0.26 °C.
3. From molecules to watts
Why should a few hundred parts per million matter at all? Because greenhouse gases absorb the infrared heat that Earth tries to radiate back to space, so the planet ends up shedding less energy than it receives from the Sun. That gap, measured in watts per square metre (W m⁻²), is called radiative forcing.
IPCC AR6 calculates it with expressions fitted to detailed line-by-line radiative transfer calculations (Meinshausen et al., 2020; AR6 WGI Table 7.SM.1). They replaced the simpler Myhre et al. (1998) formulas used in older reports, and they are the ones I implemented. With C, M and N standing for the concentrations of CO₂, CH₄ and N₂O, and a–d for the published coefficients:
CO₂: SARF = [α(C) + c₁√N] × ln(C / C₀), α(C) = d₁ + a₁(C − C₀)² + b₁(C − C₀)CH₄: SARF = (a₃√M + b₃√N + d₃) × (√M − √M₀)N₂O: SARF = (a₂√C + b₂√N + c₂√M + d₂) × (√N − √N₀)ERF = SARF × (1 + adjustment): CO₂ +5%, CH₄ −14%, N₂O +7%SF₆: ERF = 0.567 W m⁻² ppb⁻¹ × concentration
The logarithm in the CO₂ term is the reason scientists talk about “doublings”: each extra ppm warms a little less than the one before. The square roots and cross terms take care of saturation and of the overlap between the gases’ absorption bands. The expressions give the stratospheric-temperature-adjusted forcing (SARF); the adjustment at the end adds the rapid tropospheric responses and turns it into the effective radiative forcing (ERF) that actually drives surface temperature. One thing to watch if you redo the sums: C₀ = 277.15 ppm, M₀ = 731.41 ppb and N₀ = 273.87 ppb are reference constants of the fit, not the 1750 concentrations. That is why forcing is always taken as a difference from 1750: ΔF = F(today) − F(1750). SF₆ is reported in ppt, so divide by 1,000 to get ppb before multiplying by 0.567. With the latest concentrations:
| Gas | Concentration used | ERF (AR6 method) | IGCC 2025 (year 2025) |
|---|---|---|---|
| CO₂ | 427.55 ppm | 2.40 W m⁻² | 2.37 W m⁻² |
| CH₄ | 1,942.1 ppb | 0.57 W m⁻² | 0.57 W m⁻² |
| N₂O | 340.0 ppb | 0.23 W m⁻² | 0.23 W m⁻² |
| SF₆ | 12.70 ppt | 0.007 W m⁻² | (within halogenated gases) |
| Total of four gases | 3.21 W m⁻² |
Before trusting these numbers I checked them twice. Doubling CO₂ from 278.3 ppm gives 3.75 W m⁻² of SARF and 3.94 W m⁻² of ERF, which matches AR6’s published 3.75 and 3.93 W m⁻² to rounding. Then I fed in NOAA’s 2025 annual means (425.62 ppm, 1,936.0 ppb, 338.86 ppb) and got 2.37, 0.57 and 0.23 W m⁻²: IGCC’s 2025 values to two decimal places. The small CO₂ difference in the table is there because I used mid-2026 concentrations. Taken together, the four gases warm the planet as much as 492 ppm of CO₂ would on its own, which is already 82% of the forcing from a doubling of CO₂.
Greenhouse gases aren’t the only thing we have changed. Aerosols, the fine particles in air pollution, reflect sunlight and make clouds brighter, which cools the planet a little. This is IGCC’s full balance for 1750–2025:
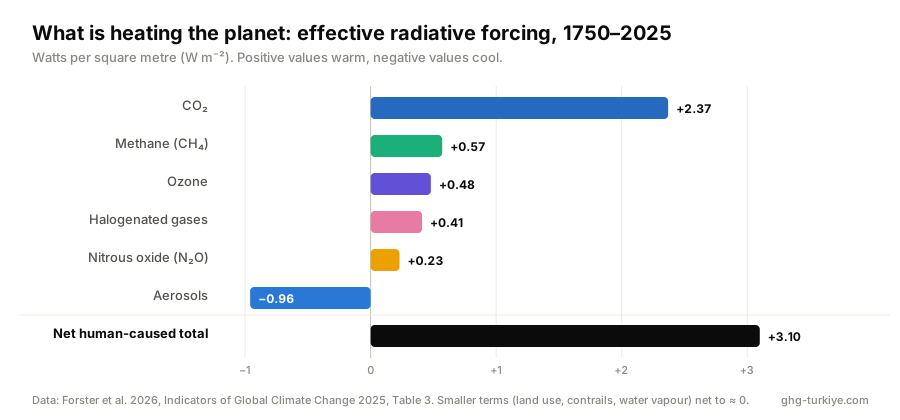
Net, human activity adds 3.10 W m⁻² (90% range 2.35–3.83). Aerosols currently cancel about a quarter of the positive forcing from greenhouse gases and ozone. As air quality improves those emissions are falling, and IGCC names this as the main driver of the acceleration in human-induced warming since the 2000s. Cleaner air is good news for our lungs, but it also removes a mask we had been wearing without noticing.
4. From watts to degrees
To turn watts into degrees you need climate sensitivity. Equilibrium climate sensitivity (ECS) is how much the world eventually warms once CO₂ has doubled and the climate has fully caught up. The IPCC AR6 best estimate is 3.0 °C (likely 2.5–4.0 °C), and a doubling of CO₂ produces 3.93 W m⁻² of effective forcing. If today’s net forcing were frozen forever, we would end up at:
ΔT_eq = ECS × F / F₂ₓ = 3.0 × 3.10 / 3.93 = 2.37 °C
Across the likely range of ECS that is 2.0–3.2 °C, and the uncertainty in the forcing itself widens it further. Without the aerosol cooling, the four gases alone would give 3.0 × 3.21 / 3.93 = 2.45 °C. So why is human-induced warming “only” 1.37 °C today? Because the oceans are soaking up most of the extra heat and the surface hasn’t caught up yet. We can measure this directly: averaged over 2006–2025, Earth took in 1.04 W m⁻² (very likely 0.82–1.25) more energy than it lost, up from 0.40 W m⁻² in 1976–1995.
That does not mean 2.4 °C is locked in. If concentrations were held at today’s level, temperatures would keep creeping up for a while. But if net CO₂ emissions reach zero, CO₂ concentrations start to fall as the ocean and land keep absorbing carbon, and the two effects largely cancel out. IPCC AR6 puts the extra warming after net zero CO₂ (the “zero emissions commitment”) close to zero, likely within about ±0.3 °C. The other gases still matter: losing aerosol pollution unmasks some warming in the short term, while cutting methane brings warming down within a few decades. The practical takeaway is simple: human-induced warming largely stops rising when net CO₂ emissions reach zero, and not before.
5. So when do we reach 2 °C?
This is where it gets concrete. One of the sturdiest results in climate science is that warming rises almost in direct proportion to the total amount of CO₂ we have ever emitted. The ratio has a clunky name, the transient climate response to cumulative emissions (TCRE), and IPCC AR6 puts it at 0.45 °C per 1,000 billion tonnes of CO₂ (likely 0.27–0.63 °C). Two useful things follow. If emissions stay flat, warming rises more or less in a straight line. And every temperature threshold corresponds to a fixed amount of CO₂ we can still emit, the “carbon budget”. I used both ideas, as two separate methods.
Method A: follow the current rate. Human-induced warming is rising by 0.027 °C a year, and CO₂ emissions are about 42 GtCO₂ a year (IGCC; the Global Carbon Budget puts 2025 at 42.2 GtCO₂, of which 38.1 from fossil fuels and 4.1 from land-use change). Divide one by the other and you get an effective rate of 0.027 / 42 × 1,000 = 0.64 °C per 1,000 GtCO₂. That is higher than CO₂’s effect alone (0.45) because rising methane and fading aerosol cooling are currently adding to the warming alongside CO₂. A note on the 42: it is CO₂ only. Counting methane, nitrous oxide and fluorinated gases as CO₂-equivalent, total greenhouse gas emissions averaged 54.6 billion tonnes a year over 2015–2024 (IGCC). The method works in CO₂ because carbon budgets and TCRE are defined that way; the effect of the other gases is already folded into the 0.64. If nothing changes:
T(year) = 1.37 °C + 0.64 °C × cumulative CO₂ emissions from 2026 / 1,000 GtCO₂
| Threshold | Calculation (emissions flat at 42 GtCO₂/yr) | First year above | Range from the likely warming rate |
|---|---|---|---|
| 1.5 °C | (1.5 − 1.37) / 0.027 = 4.8 years after 2025 | 2030 | 2029–2032 |
| 2.0 °C | (2.0 − 1.37) / 0.027 = 23.3 years | 2049 | 2041–2057 |
| 3.0 °C | (3.0 − 1.37) / 0.027 = 60.4 years | 2086 | 2066 – after 2100 |
“First year above” is the first calendar year whose value passes the threshold: for 2 °C, T(2048) = 1.99 °C and T(2049) = 2.02 °C, so 2025 + 23.3 years lands in 2049. For 1.5 °C this lines up with IGCC’s own statement that, at the current level and rate, human-induced warming reaches 1.5 °C “around the year 2030”.
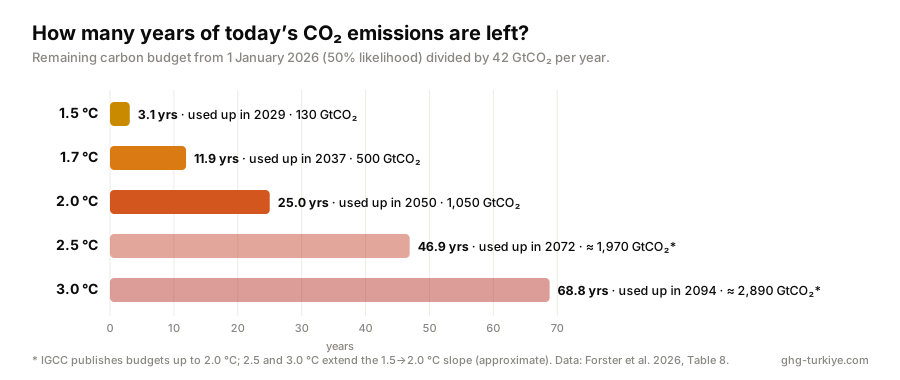
Method B: count down the carbon budget. IGCC also estimates how much CO₂ can still be emitted from 1 January 2026 for a given chance of staying under each threshold. These budgets assume that between 2020 and 2050 methane emissions fall by about half and nitrous oxide by about a fifth. Divided by today’s 42 GtCO₂ a year:
| Threshold | Remaining budget from 2026 (50% chance) | Years at 42 GtCO₂/yr | Runs out in |
|---|---|---|---|
| 1.5 °C | 130 GtCO₂ | 3.1 | 2029 |
| 1.7 °C | 500 GtCO₂ | 11.9 | 2037 |
| 2.0 °C | 1,050 GtCO₂ | 25.0 | 2050 |
| 2.5 °C* | ≈ 1,970 GtCO₂ | 46.9 | ≈ 2072 |
| 3.0 °C* | ≈ 2,890 GtCO₂ | 68.8 | ≈ 2094 |
* IGCC publishes budgets up to 2.0 °C. I extended the 2.5 and 3.0 °C rows with its own 1.5→2.0 °C slope (1,840 GtCO₂ per degree), so treat them as approximate. If you want better odds than a coin toss, say 67%, the 2 °C budget shrinks to 860 GtCO₂ and is gone in 2046. The Global Carbon Budget 2025 gets to almost the same place by a slightly different route (it averages an update of the AR6 method with the previous IGCC assessment): 170, 525 and 1,055 GtCO₂ for 1.5, 1.7 and 2 °C from the start of 2026 at 50% likelihood, or roughly 4, 12 and 25 years of current emissions. It also notes that every additional ~180 GtCO₂ adds about 0.1 °C, which fits IGCC’s slope.
Up to 2 °C the two methods agree almost to the year (2049 versus 2050). At 3 °C they drift apart (2086 versus ≈ 2094), mainly because the budgets assume methane and other non-CO₂ emissions come down, while Method A assumes today’s mix carries on. I find that gap useful in its own right: it is roughly the time that cutting methane would buy us.
6. A sanity check against the data
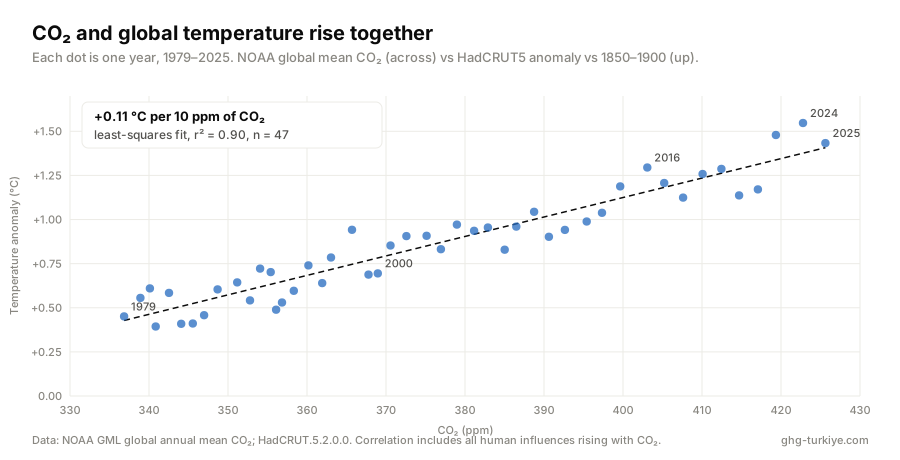
Physics first, then a reality check. If I plot each year’s global CO₂ against that year’s temperature anomaly for 1979–2025 (47 years), the least-squares line rises by 0.11 °C for every 10 ppm, with r² = 0.90. Put simply, a straight line in CO₂ accounts for 90% of the variation in annual global temperature over that period. Correlation isn’t causation, and this line also soaks up every other human influence that grew alongside CO₂; the causal link comes from sections 3 and 4. Still, it is good to see the data behave the way the physics says it should.
7. What would move the dates
None of these years is fixed. They depend on what happens to emissions from here on, and because warming tracks cumulative emissions, the effect of cuts shows up quickly in the numbers. With Method A:
- Emissions flat at 42 GtCO₂ a year: 2 °C in 2049, 3 °C in 2086.
- Emissions falling 3% a year: 2 °C slips to 2065, and warming is about 2.2 °C by 2100.
- Emissions falling 5% a year: 2 °C is never reached; warming levels off near 1.9 °C.
- Emissions falling 7% a year: warming levels off near 1.75 °C.
In every one of these paths the human-induced trend still crosses 1.5 °C in 2030–2031, consistent with IGCC’s finding that the remaining 1.5 °C budget is only about three years of current emissions. What this decade decides is how far past 1.5 °C we go, and for how long. You can see it for yourself: open the chart with emissions falling 5% a year, then drag the sliders and compare.
A few honest caveats
The scenario model is deliberately simple: one linear relationship calibrated to today’s observed warming rate. It is good for order of magnitude and timing under a single, stated assumption, and it is not a substitute for Earth system models. The carbon budgets include only the uncertainty in TCRE; IGCC notes they could be about ±200 GtCO₂ different depending on how far non-CO₂ emissions fall. A single year above 1.5 °C does not mean the Paris goal has been breached, because the IPCC assesses warming levels with 20–30-year averages: 2024 was above 1.5 °C, but the long-term level is expected to get there around 2030. The temperature series here comes from one dataset (HadCRUT5), while IGCC averages four; the difference is a few hundredths of a degree. And the latest-year greenhouse gas values are provisional, so NOAA may still revise them slightly.
References
- Forster, P. M., Walsh, T., Smith, C., et al. (2026). Indicators of Global Climate Change 2025: annual update of key indicators of the state of the climate system and human influence. Earth System Science Data, 18, 3889–3933. doi:10.5194/essd-18-3889-2026
- Friedlingstein, P., O’Sullivan, M., Jones, M. W., et al. (2026). Global Carbon Budget 2025. Earth System Science Data, 18, 3211–3288. doi:10.5194/essd-18-3211-2026
- IPCC (2021). Climate Change 2021: The Physical Science Basis. Contribution of Working Group I to the Sixth Assessment Report. Cambridge University Press. Chapters 2, 4 and 7, and Chapter 7 Supplementary Material. ipcc.ch/report/ar6/wg1
- Meinshausen, M., Nicholls, Z. R. J., Lewis, J., et al. (2020). The shared socio-economic pathway (SSP) greenhouse gas concentrations and their extensions to 2500. Geoscientific Model Development, 13, 3571–3605. doi:10.5194/gmd-13-3571-2020
- Morice, C. P., Kennedy, J. J., Rayner, N. A., et al. (2021). An updated assessment of near-surface temperature change from 1850: the HadCRUT5 data set. Journal of Geophysical Research: Atmospheres, 126, e2019JD032361. doi:10.1029/2019JD032361. Data: HadCRUT 5.2.0.0, metoffice.gov.uk/hadobs/hadcrut5
- Lan, X., Tans, P., Thoning, K. W., et al. Trends in globally-averaged CO₂, CH₄, N₂O and SF₆. NOAA Global Monitoring Laboratory. gml.noaa.gov/ccgg/trends (accessed 7 November 2026)
Every calculation in this piece runs live, with fresh data, on the Global Greenhouse Gas Monitoring page. If you spot something I got wrong, I would genuinely like to hear about it.